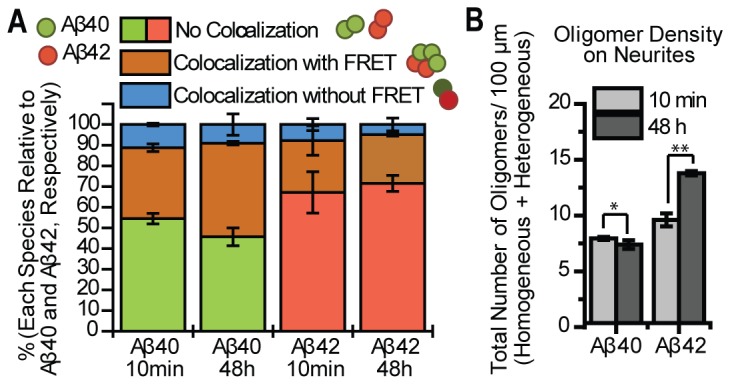
Figure 4. Heterogeneous species increases over time due to continuous binding of Aβ42 to the neurites.

2 nM Aβ40 and 2 nM Aβ42 were mixed and incubated with cultured neurons at the same time. By comparing the population changes of each species, we get general idea of how these species interact over time. (A) The relative number of oligomers of each species in each sample (percentage of each species). The blue shading (colocalization without FRET) represents the co-localized Aβ40 and Aβ42 that do not show a FRET signal. This species accounts for at most 10% for both Aβ40 and Aβ42. The green shaded sections represent the percentage of homogeneous Aβ40 in total Aβ40 species, and show the fraction of homogeneous Aβ40 to decrease over time. The red bar represents the percentage of homogeneous Aβ42 in total Aβ42 species. This number remains almost unchanged over time, indicating the fraction of homogeneous Aβ42 remains unchanged. The brown bar represents the percentage of heterogeneous mixed species in total Aβ40 (left two) or Aβ42 (right two) species. The fraction of heterogeneous species among the whole Aβ40 species increases over time (from 35% to 45%), whereas the fraction of heterogeneous species among whole Aβ42 species remains similar. (B) The density (number of Aβ42 per 100 µm) of Aβ42 oligomers on the neurites (including both homogeneous and heterogeneous species) is slightly higher than Aβ40 at 10 minutes and becomes significantly larger by 48 hours, whereas the total number of Aβ40 is only slightly changed (unpaired two-tailed t-test, *P > 0.1 and **P < 0.05). Data was averaged from two different experiments, at least 5 images each and each image contained at least 50 oligomers. Error bars represent standard deviation of the mean. Figure 5 provides a pictorial display of the implications.
