
Figure 10.
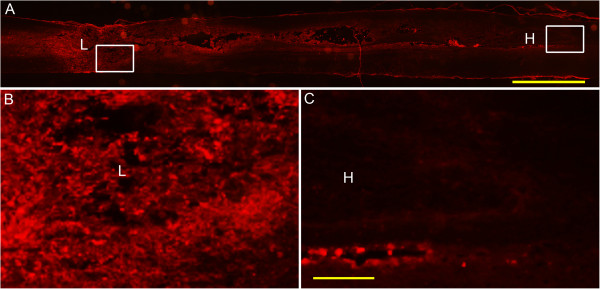
Representative picture of immunohistochemistry for rat immunoglobulin G (IgG) in the spinal cord at 3 days post injury. (A) IgG immunoreactive product is obvious in the lesion area (left box), while in the far-away hematoma (right box), there is little immunolabeling for IgG. (B) and (C) are higher magnification of the boxes in the areas adjacent to the lesion site and to the hematoma, respectively. Bar = 2 mm in (A), 200 μm in (B) and (C).