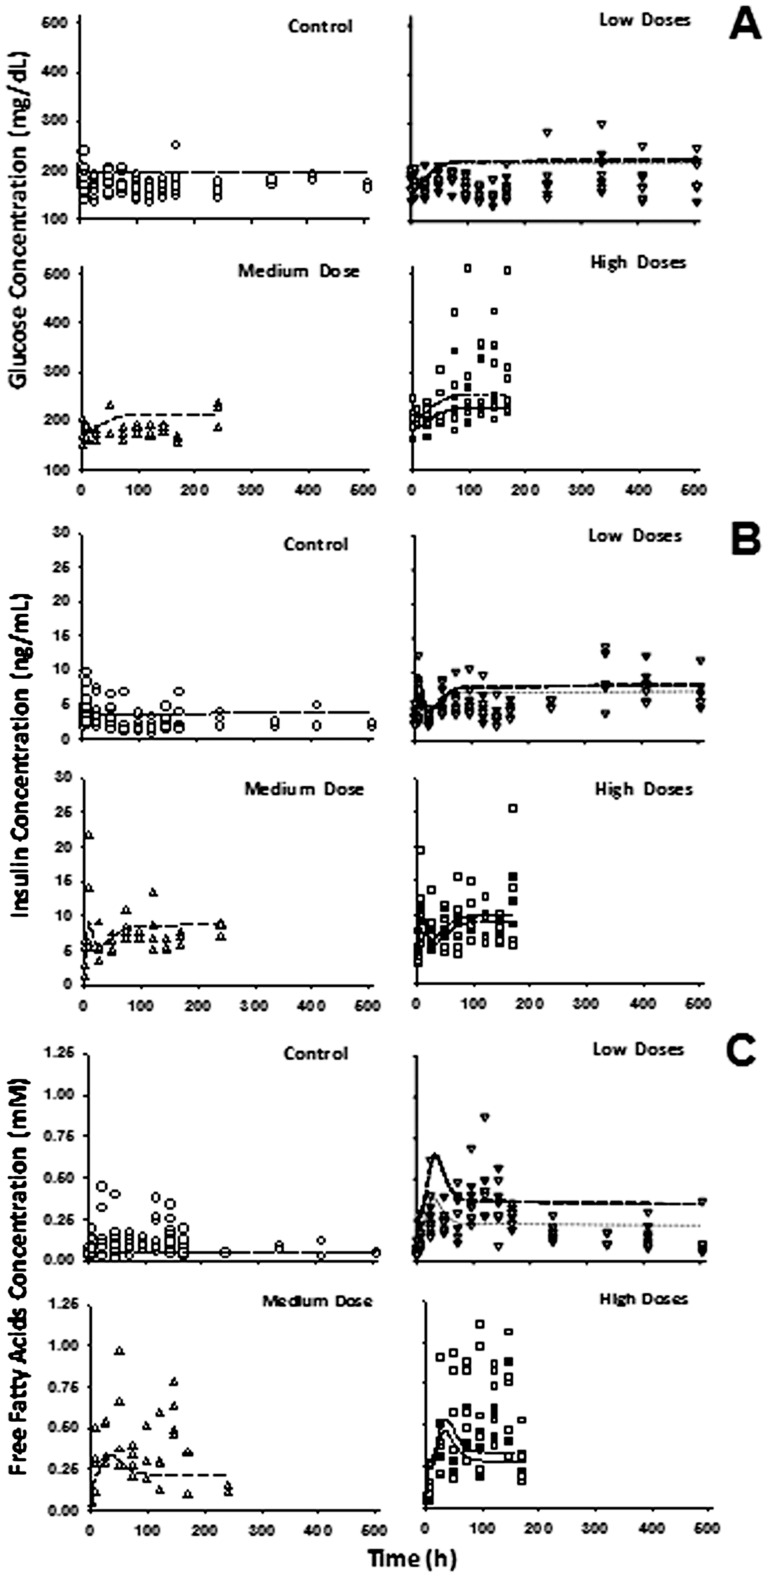
Figure 8. Plasma glucose (A), insulin (B) and FFA (C) versus time profiles during infusion of saline (○), 0.03 (▾) and 0.1 (∇) mg/kg/h MPL (Low doses), 0.2 (Δ) mg/kg/h MPL (Medium dose), and 0.3 (▪) and 0.4 (□) mg/kg/h MPL (High doses).
Lines depict simultaneous fittings of glucose, insulin, and FFA with Eq. (18) – (21) for saline (light dotted line), 0.03 (heavy dotted line) and 0.1 mg/kg/h (light long dash line), 0.2 mg/kg/h (heavy long dash line) and 0.3 (light short dash line) and 0.4 mg/kg/h (heavy short dash line). The PD parameters are listed in Table 6.

