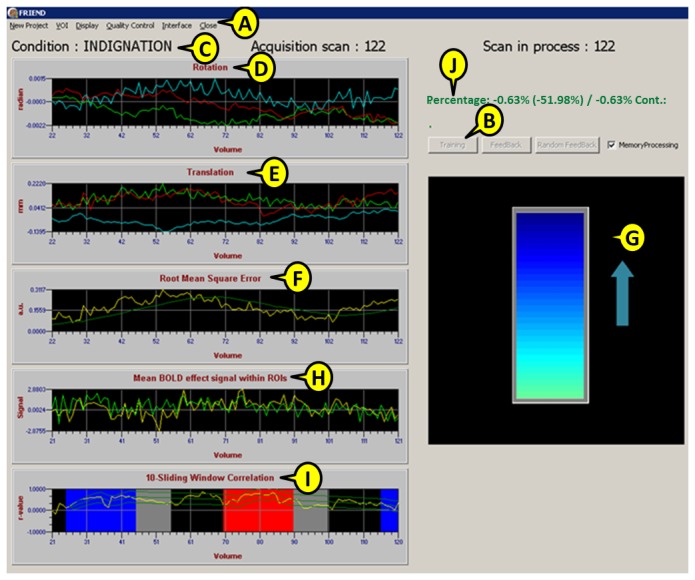
Figure 3. FRIEND’s control window, including: the main menu (A), training and feedback buttons (B), current experimental condition (C), rotation in radians (D), translation in mm (E) and root mean square error from motion parameters (F).

User-defined neurofeedback stimuli to be presented to participants (a thermometer in this case) are displayed when the feedback option is selected (G). For single ROI processing, time-course, mean signal within specified ROIs, signal change and condition blocks will be shown (H). In the case of sliding-window ROI correlation analysis, a similar graph shows the level of correlation, sliding window size and upper and lower bounds of correlation targets (I). During the SVM classification sessions, the interface shows the classification phase, the current scan and the model-based cumulative classification accuracy (J).
