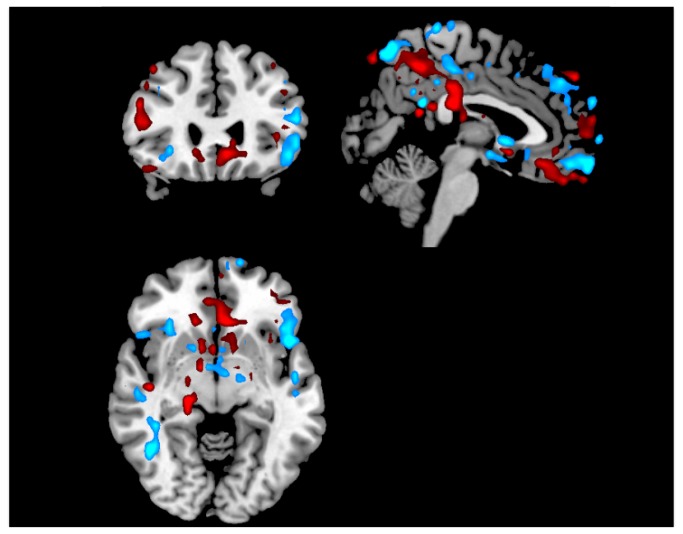
Figure 7. Weight map from the SVM classification of a participant of an emotional memory neurofeedback session.
The weights are SVM coefficients determining the discriminant hyperplane, which depicts the relevance of each voxel for the classification between positive and negative conditions. Blue/red colors refer to the sign of these coefficients (negative/positive, respectively). FRIEND saves a NIfTI file containing these maps, which can be viewed using any MRI visualization software. This is only an illustrative map with an arbitrary threshold and slice selection.

