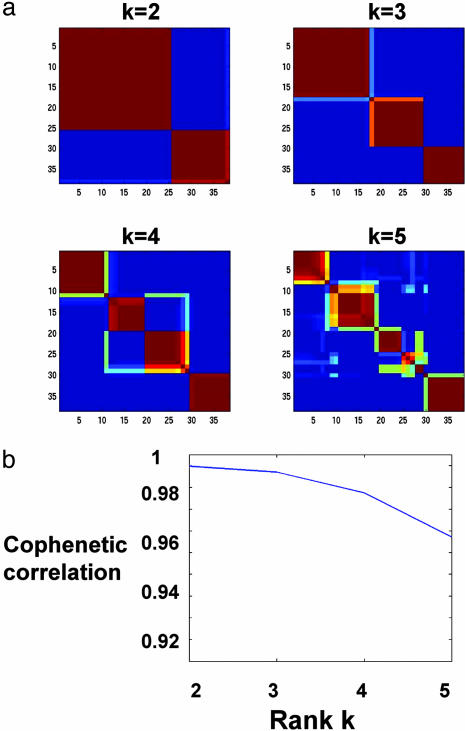
Fig. 4.
(a) Reordered consensus matrices averaging 50 connectivity matrices computed at k = 2–5 for the leukemia data set with the 5,000 most highly varying genes according to their coefficient of variation. Samples are hierarchically clustered by using distances derived from consensus clustering matrix entries, colored from 0 (deep blue, samples are never in the same cluster) to 1 (dark red, samples are always in the same cluster). Compositions of the leukemia clusters determined by HC of consensus matrices are as follows: for k = 2: {(25 ALL), (11 AML and 2 ALL)}, k = 3: {(17 ALL-B), (8 ALL-T and 1 ALL-B), (11 AML and 1 ALL-B)}, k = 4: {(11 ALL-B), (7 ALL-B and 1 AML), (8 ALL-T and 1 ALL-B), (10 AML)}. (b) Cophenetic correlation coefficients for hierarchically clustered matrices in a.

