
Figure 6.
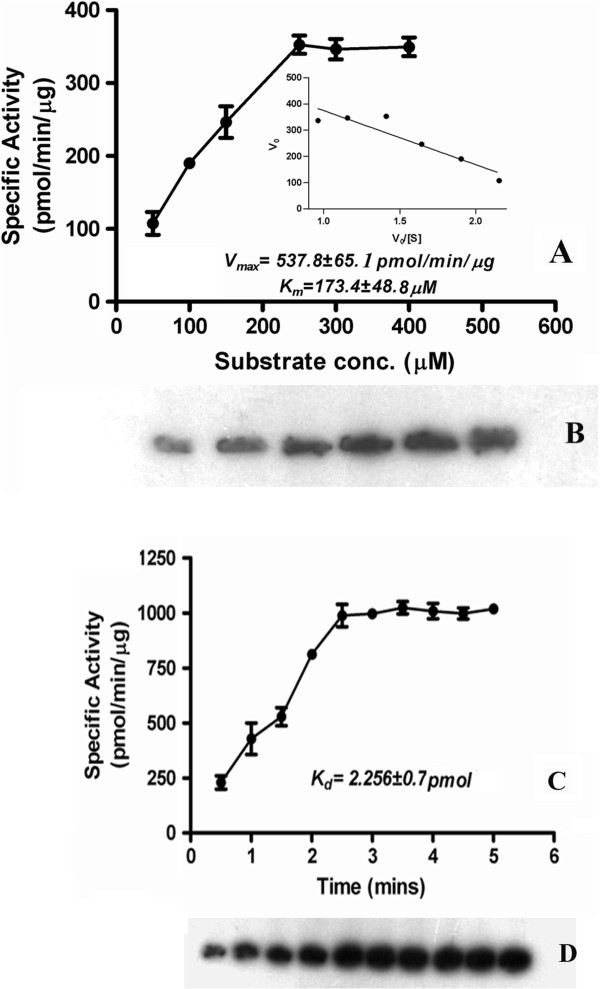
Saturation curve of BbKst activity at different concentrations of casein. A. Data represents average of three independent assays of specific activity of the enzyme in presence of different casein concentrations. Eadie-Hofstee plot of the average values for each data set is shown in the inset. Error bars indicate ± SD (n = 3). B. Autoradiogram at different substrate concentrations. C. Time-dependent activation of BbKst. Average data of three independent assays presented as saturation curves with specific activity versus casein concentration as indicated. Error bars indicate ± SD (n = 3). Dissociation constant for Kd of both the reactions are shown within the graphs. D. Autoradiogram of casein phosphorylation at different time intervals.