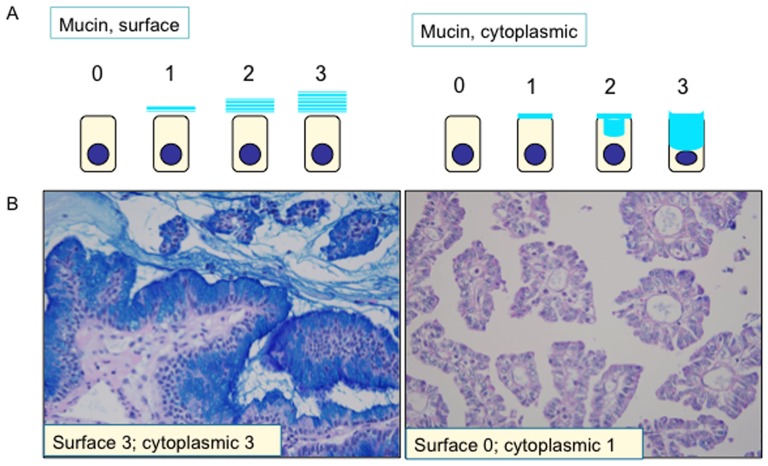
Figure 1. Semiquantitative evaluation of surface and intracellular mucin in intraductal papillary neoplasms of the bile duct (IPNBs).
A) Schema of score 0–3 for surface and cytoplasmic mucin. B) Example of IPNBs with high- and low- mucin production. Left, an example of IPNB with high-mucin production; right, an example of IPNB with low-mucin production.

