Figure 4.
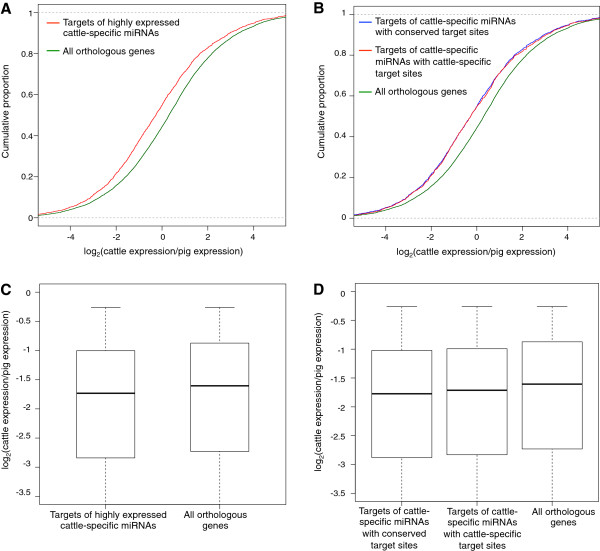
Comparison of target mRNA expression between cattle and pigs. Cumulative distribution function (CDF) plots and boxplots of log2-transformed gene expression (cpm) ratios. Each ratio is calculated as the expression of a bovine mRNA divided by the expression of its porcine orthologue. (A) The CDFs for targets of highly expressed cattle-specific miRNAs (n = 1699) and all orthologous genes (n = 8680) are significantly different (p = 1.014e-15) by the Kolmogorov-Smirnov test. Genes that are targeted by both conserved and cattle-specific miRNAs were excluded from this analysis. (B) The CDFs for targets of highly expressed cattle-specific miRNAs with conserved target sites (n = 757) and all orthologous genes (n = 8680) are significantly different (p = 1.118e-11) by the Kolmogorov-Smirnov test, as are the CDFs for targets of highly expressed cattle-specific miRNAs with cattle-specific target sites (n = 1096) and all orthologous genes (p = 1.124e-10). Target genes containing both conserved and cattle-specific target sites were excluded. (C) Boxplot of expression ratios for targets of the highly expressed cattle-specific miRNAs (median logFC = −1.73) and all orthologous genes (median logFC = −1.60). (D) Boxplot of expression ratios for target genes of highly expressed cattle-specific miRNAs having conserved target sites (median logFC = −1.77), having cattle-specific target sites (median logFC = −1.77), and target genes of conserved miRNAs (median logFC = −1.60).

