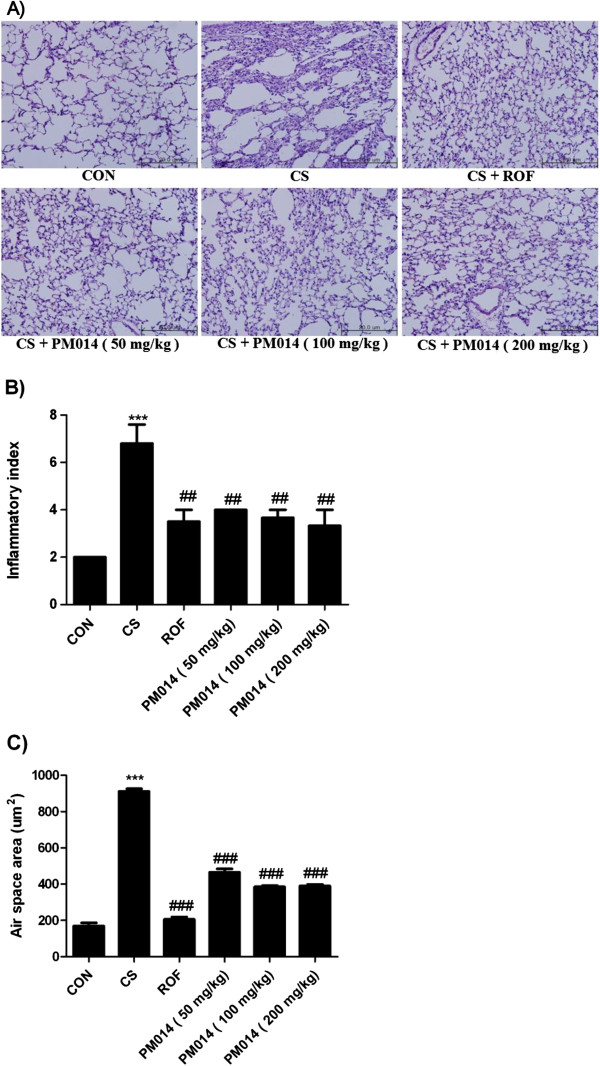
Figure 4.
The effect of PM014 morphology changes in CS exposure mice. A) Right lower lobes of mice were dissected and stained with hematoxylin and eosin. B) The degree of inflammation was quantified using a semi-quantitative scale. C) Air space was calculated by Image Pro-Plus 5.1 software as described in the Materials and Methods section. Data are shown as mean ± S.E.M. Statistical analyses were conducted by one-way ANOVA followed by Newman-Keuls Multiple Comparison test (***p < 0.001 vs. CON, ##p < 0.01 vs. CS).

