
Figure 3.
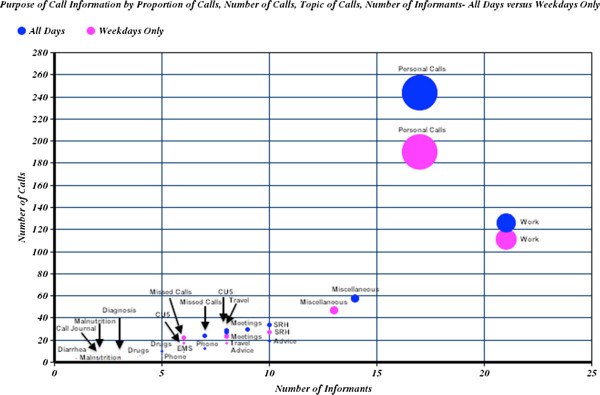
Bubble Graph of Call Journal’s Purpose of Call Section. Bubble Graph of Call Journal’s Purpose of Call Section Where Volume Represents the Percent of Total Calls Placed Over the Time Period that Call Journals were Kept (23 July to 16 August 2011), All Days Compared to Weekdays Only.