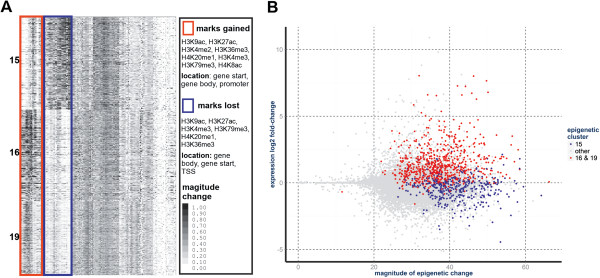
Figure 2.

Epithelial-mesenchymal transition-related gene clusters (EMT-GCs) are differentially expressed and show antipodal patterns of chromatin remodeling. (A) Differential epigenetic profiles (DEPs) of the EMT-GCs. Heat map shows the DEPs of genes (rows) from the EMT-GCs (other clusters are omitted). Groups of DEP columns that distinguish clusters 16 and 19 from 15 are indicated through colored boxes. Summary of the antipodal patterns of change in histone modification levels are provided in the table. The red box shows changes specific to clusters 16 and 19. The blue box shows changes specific to cluster 15. (B) EMT-GCs in the differential expression-epigenetic plane. Each dot represents a gene, colored dots are genes from the EMT-GCs: 16 and 19 (red), and 15 (blue). Differential gene expression (log2 fold-change) is on the Y-axis. The total magnitude of epigenetic difference (sum of DEP elements) at a gene locus is on the X-axis.
