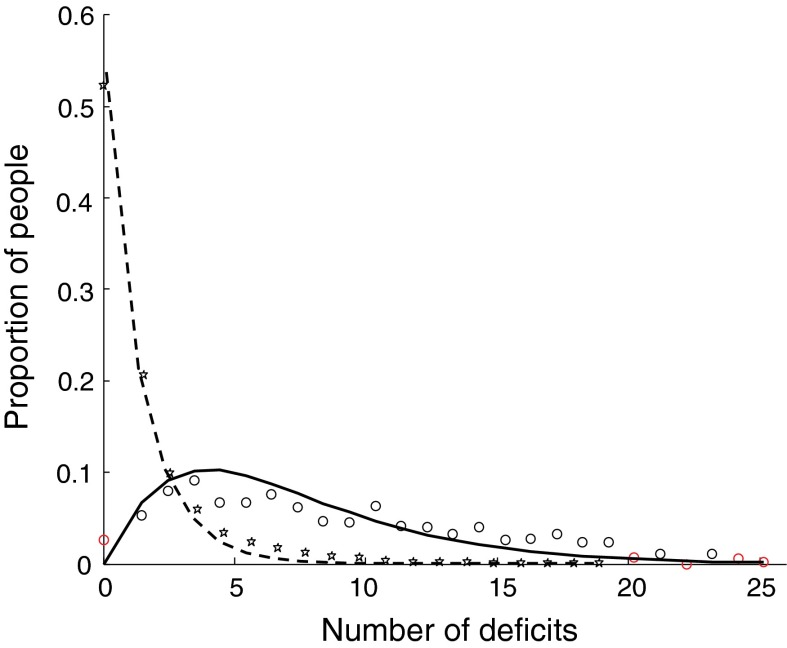
Fig. 2.
Distribution of the number of deficits for the two age groups: 20–30 years old (stars are the observational data and the dashed line is the exponential fit with the exponent −0.6) and 75–100 years old (circles are the observational data and the solid line is the gamma fit with the shape and scale parameters of 2.1 and 3.2, respectively)

