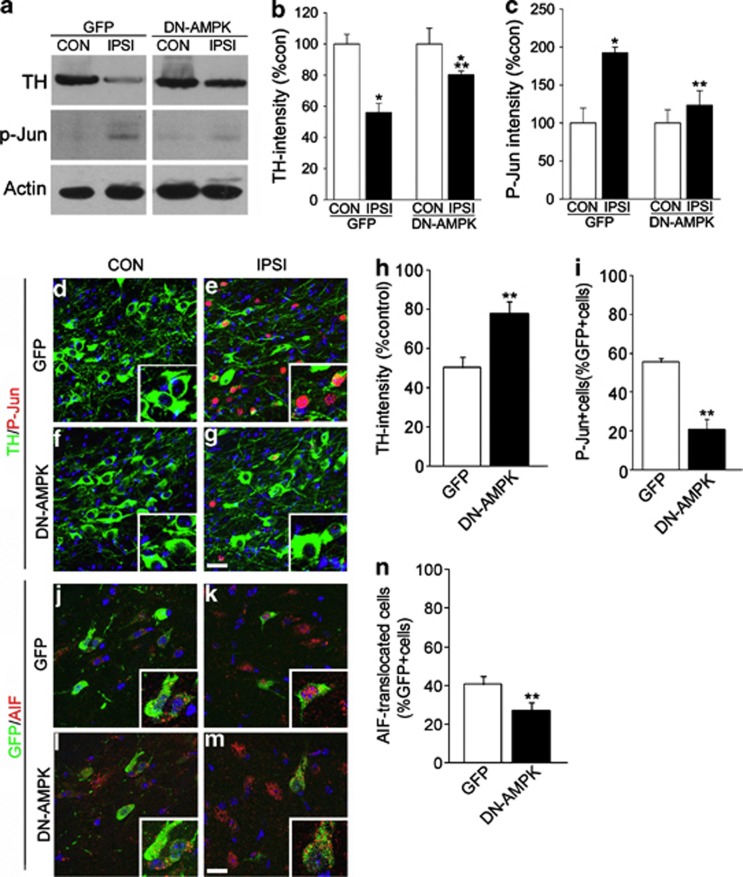
Figure 7.
Inhibition of DA neuronal degeneration by DN-AMPK. (a) Immunoblots of TH, P-Jun, and actin in the CON and IPSI sides of GFP or DN-AMPK virus-injected SN 2 weeks after striatal 6-OHDA injection. (b, c) Quantification of the relative optical densities of TH (b) and p-Jun (c). n=3; *P<0.05, Student's t-test comparison with CON versus IPSI; **P<0.05, Student's t-test comparison with GFP versus DN-AMPK virus-injected mice. (d–g) TH (green) and P-Jun (red) immunolabeling in the CON (d, f) and IPSI (e, g) sides of the SN 2 weeks after 6-OHDA injection with GFP (d, e) or DN-AMPK (f, g) virus. (h–i) Quantification of TH intensity (h) and P-Jun+ cells (i) among GFP-labeled cells. Data are expressed as the percentage mean±S.E.M., n=4. *P<0.05, Student's t-test comparison. (j–m) Double labeling of GFP and AIF in CON (j, l) and IPSI (k, m) sides of GFP (j, k) and DN-AMPK (l, m) virus-injected mice. Nuclei were counterstained with Hoechst33342 in blue. Insets show magnified images. (n) Percentage of TH+ cells exhibiting nuclear AIF signals. Data are expressed as the percentage mean±S.E.M., n=4. *P<0.05, Student's t-test comparison

