Figure 8.
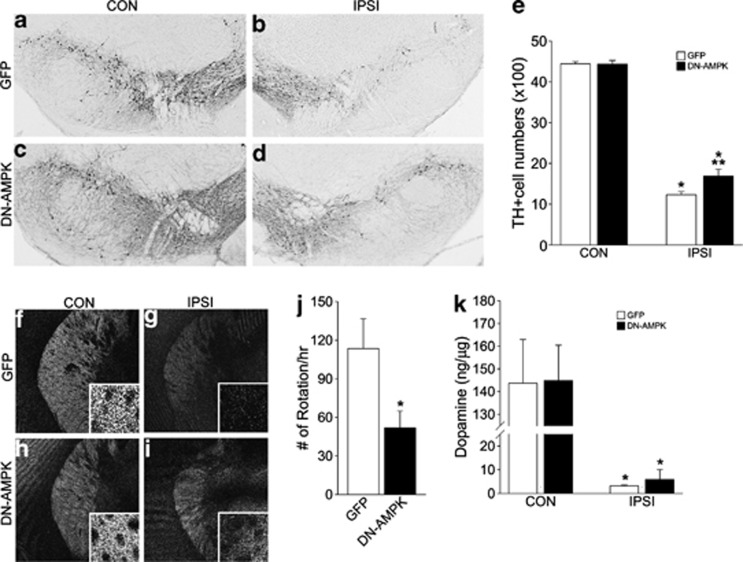
Long-term effect of DN-AMPK on DA neuronal degeneration. (a–d) TH labeling of CON (a, c) and IPSI (b, d) SN of GFP (a, b) and DN-AMPK virus-injected mice (c, d) 6 weeks after 6-OHDA injection. (e) Quantification of TH-expressing DA neurons in the CON and IPSI sides of SN in GFP and DN-AMPK virus-injected mice. Data are expressed as %mean±S.E.M compared with the mean value of TH intensity of the CON side in the same animal, n=4. *P<0.05, Student's t-test comparison with CON versus IPSI sides; **P<0.05, Student's t-test comparison with GFP versus DN-AMPK mice. (f–i) Distribution of TH immunoreactive fibers in the CON (f, h) and IPSI (g, i) sides of GFP (f, g) and DN-AMPK virus-injected mice (h, i). (j) Number of rotations per hour following apomorphine treatments, n=6 for GFP and n=7 for DN-AMPK mice. *P<0.05, Student's t-test comparison with CON versus IPSI sides. (k) Striatal DA levels in GFP and DN-AMPK virus-injected mice, n=5

