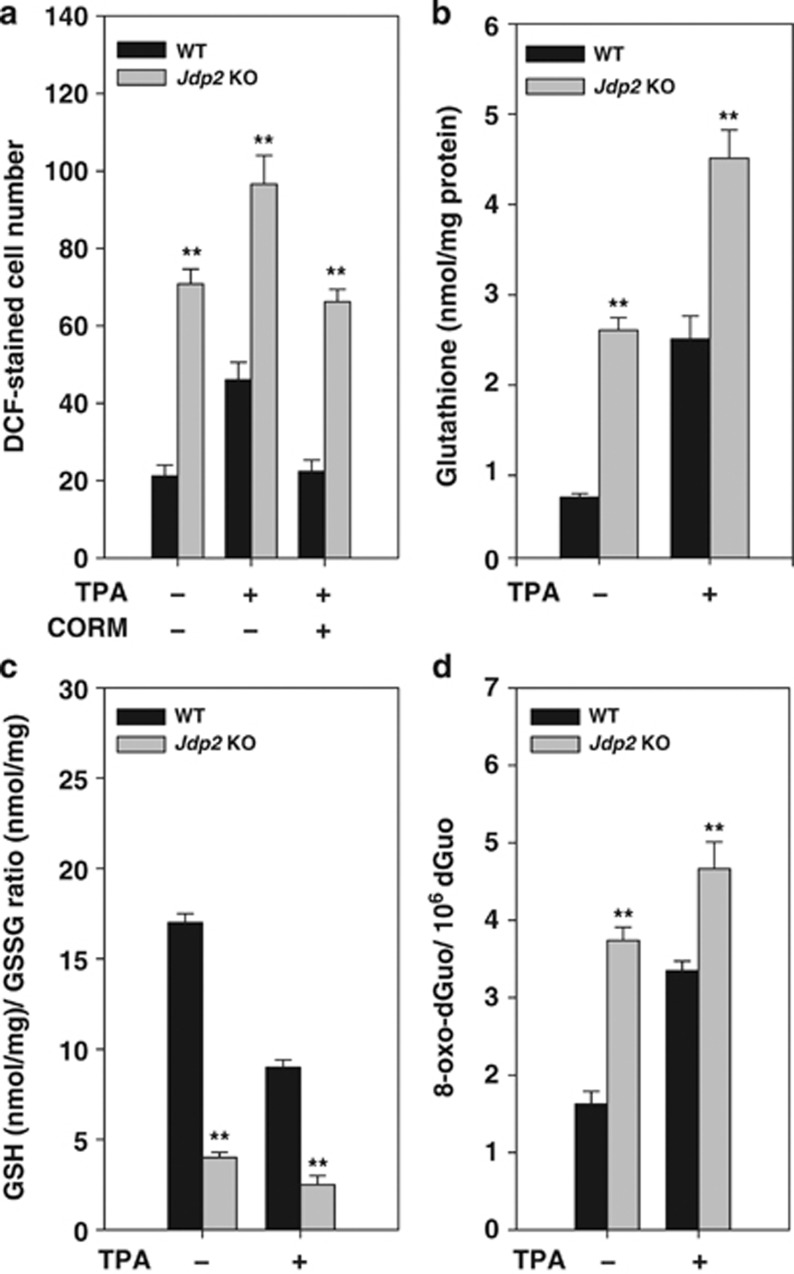
Figure 1.
JDP2 controls ROS production. (a) MEFs were seeded (5 × 10³ per well) into eight-chambered cover glasses immersed in 500 μl of 10% FBS–DMEM and exposed or unexposed to TPA (10−6 M) or with or without 50 nmol/l of CORM. Intracellular ROS levels were measured using H2DCFDA staining, as described in the Materials and Methods. (b) Determination of the concentration of total glutathione in WT and Jdp2 KO MEFs incubated with TPA (10−6 M) for 24 h. (c) Determination of the GSH/GSSG ratio in WT and Jdp2 KO MEFs incubated with TPA (10–6 M) for 24 h. The ration of GSH/GSSG was calculated in the Materials and Methods. (d) 8-Oxo-dGuo levels in WT and Jdp2 KO MEFs in the presence or absence of TPA (10–6 M) for 24 h. Data are presented as mean±S.D. (n=3). The data were analyzed using Student's t-test; **P<0.01

