Figure 6.
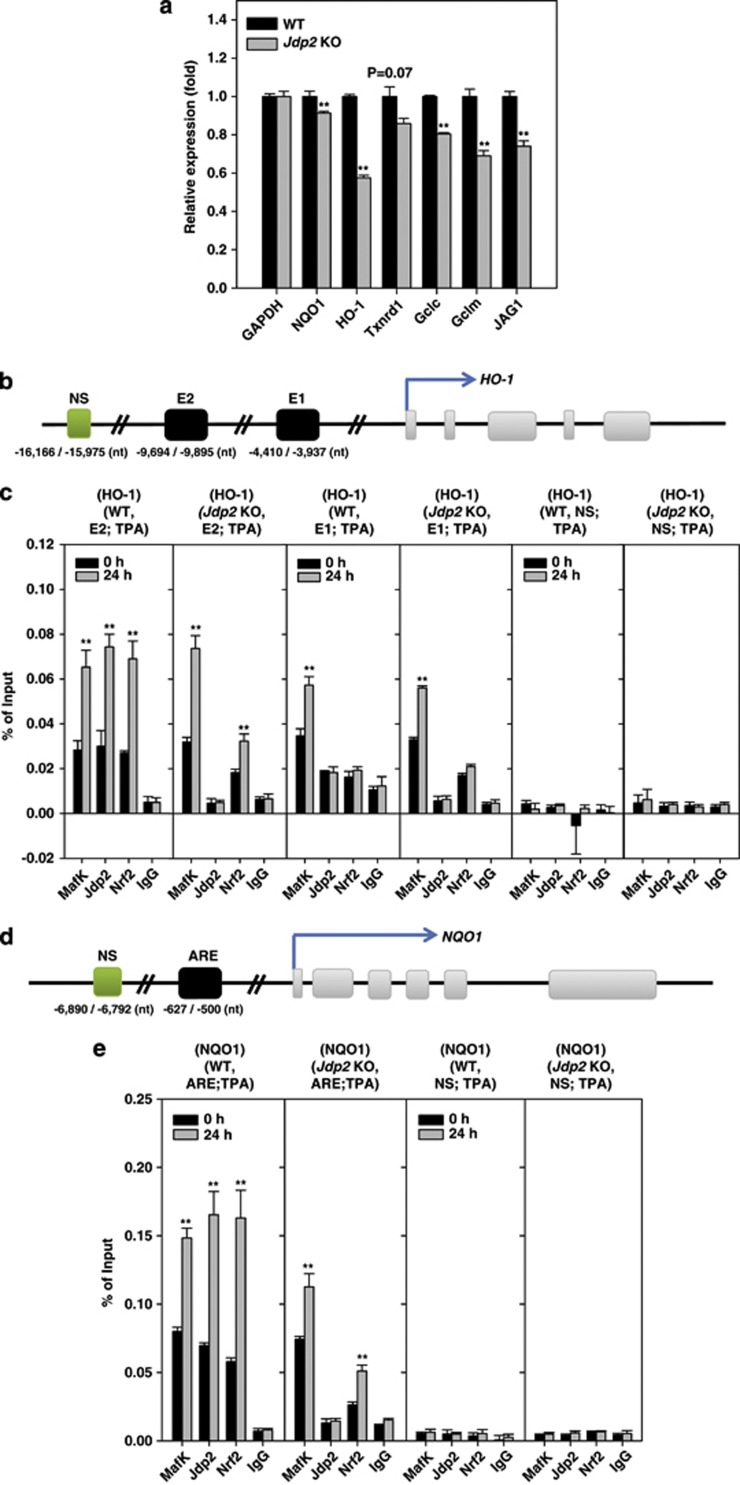
JDP2 regulates the expression of Nrf2 target genes. (a) qPCR analysis of Nrf2 target genes in WT and Jdp2 KO MEFs. The expression levels determined are relative to the level of GAPDH. Error bars denote the S.D. from duplicate reactions by real-time PCR as described in Materials and Methods. The primer sequences of each Nrf2 target gene are listed in Supplementary Table SIII. *P<0.05; **P<0.01. (b–e) The ChIP–qPCR analyses were performed with chromatin extracts from WT and Jdp2 KO MEFs using specific antibodies (Ab) for Jdp2, Nrf2, MafK and IgG (as a negative control). (b and d) Schematic representations indicate the positions of primer motifs in HO-1 (b) and NQO1 promoter regions (d). Extracts from TPA-treated (24 h) or -untreated MEFs (5 × 10⁸ cells) from WT and Jdp2 KO mice were subjected to ChIP assays with the indicated antibodies. Precipitated DNA and input DNA (1/20-fold) were analyzed using PCR with primers specific for E1 and E2 of the HO-1 (c) and ARE of the NQO1 (e) promoters. The nonspecific sequence motifs (NS) were used as a negative control (Supplementary Table SII). The data represent the mean±S.D. (n=3) with P-values from Student's unpaired t-tests: *P<0.05; **P<0.01

