Figure 2.
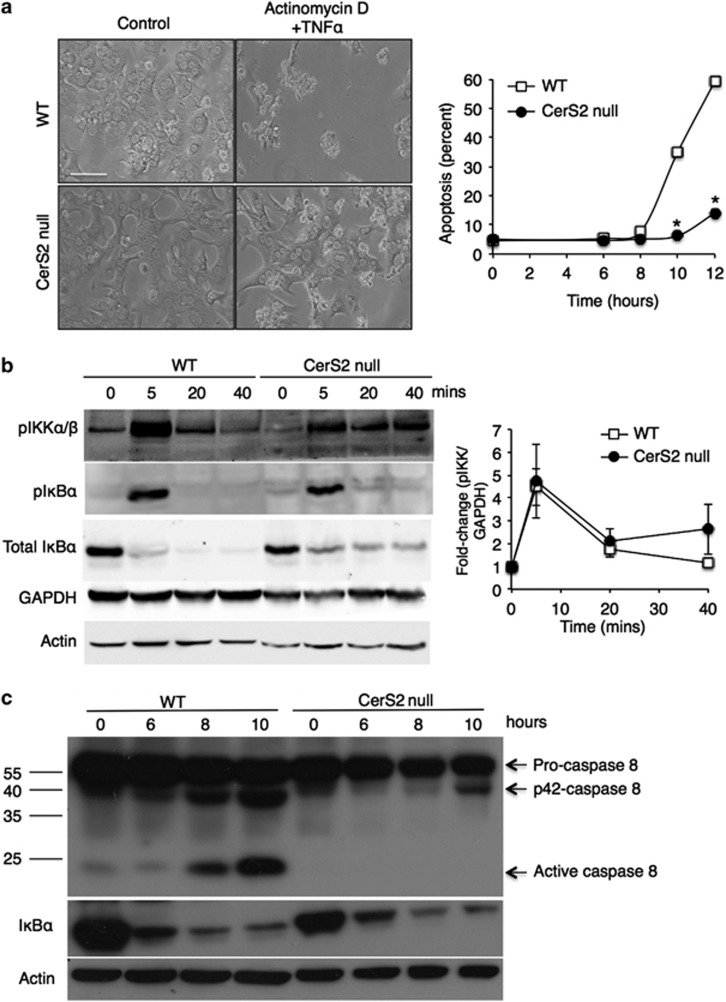
Activation of TNFR1 complex I signaling but not complex II signaling in cultured hepatocytes from CerS2 null mice. Cultured hepatocytes from WT and CerS2 null mice were treated with TNFα (100 ng/ml) and ActD (500 ng/ml) for the indicated times. (a) Left-hand panels show representative phase contrast images of hepatocytes 12 h after treatment (scale bar=100 μm) and the right-hand panel shows the extent of cell death (measured by LDH release). n=3, *P<0.0005. (b) The left-hand panel shows phosphorylation of IKKα/β and phosphorylation and degradation of IκBα. Means±S.E.M. are shown in the right-hand panel, n=3. GAPDH and β-actin are shown as loading controls. (c) Pro-caspase 8 cleavage to its active p18 form and IκBα degradation. Results are from a typical experiment repeated three times. Mr markers are shown on the left, and the cleavage products indicated on the right. β-Actin is shown as a loading control

