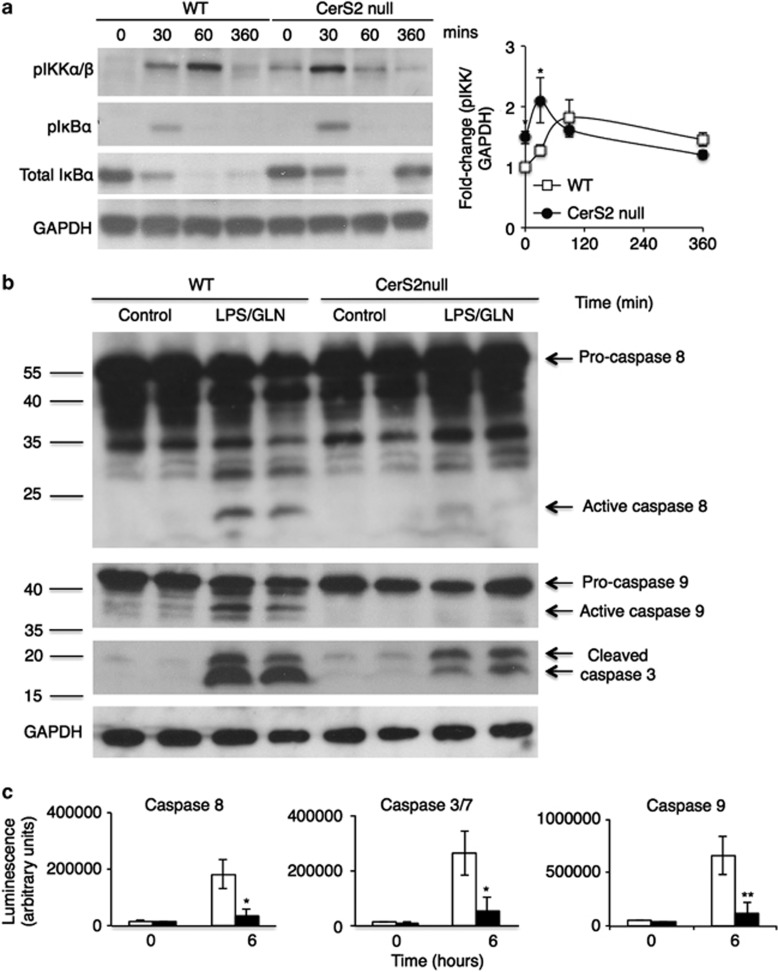
Figure 3.
TNFR1 complex I signaling in LPS/GLN-treated CerS2 null mice. WT or CerS2 null mice were injected with 15 μg/kg LPS and 800 mg/kg GLN and various parameters measured at the indicated times. (a) The left-hand panel shows IKKα/β phosphorylation and IκBα phosphorylation and degradation. Means±S.E.M. are shown in the right-hand panel, n=3, *P<0.05. GAPDH is shown as a loading control. (b) Western blot analysis of caspases 8, 9 and 3 and their cleavage products 6 h after LPS/GLN injection. Mr markers are shown on the left, and the cleavage products indicated on the right. Results are from a typical experiment repeated five times, which gave similar results. (c) Activities of caspases 8, 3/7 and 9. Values are means±S.D., n=5, *P<0.005; **P<0.0005

