Figure 6.
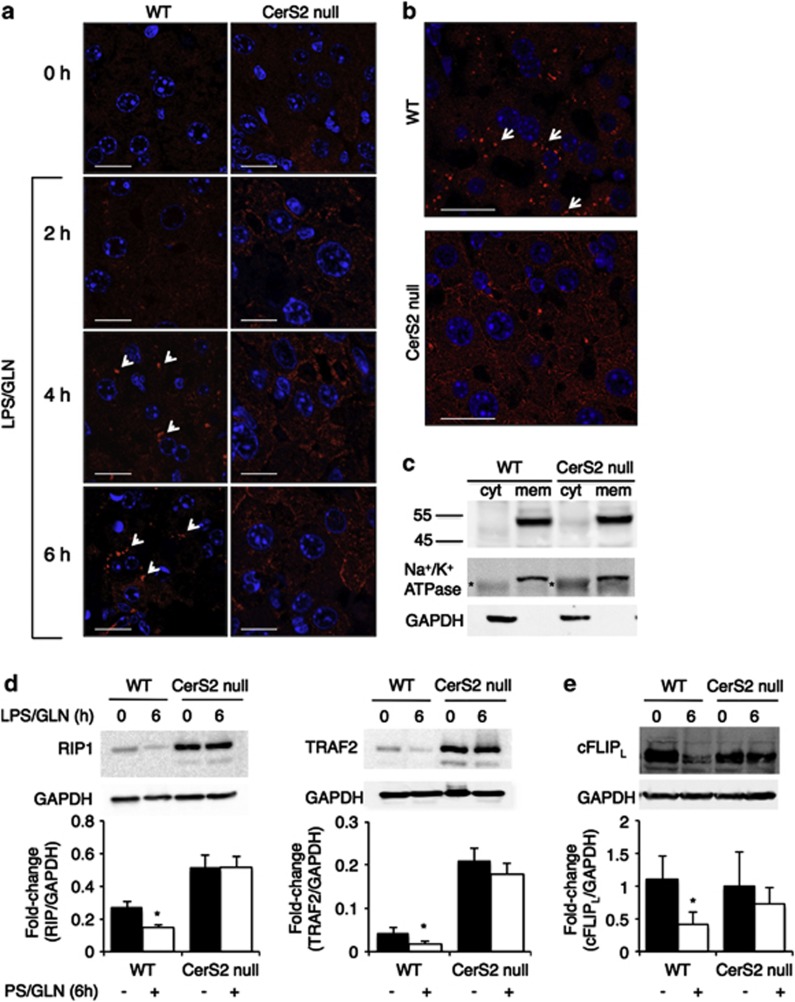
TNFR1 internalization is inhibited in CerS2 null mouse liver. (a) WT and CerS2 null mice were injected with 15 μg/kg LPS and 800 mg/kg GLN for the indicated times. After isolation of livers, TNFR1 localization was determined by confocal microscopy. Blue indicates DAPI and red indicates TNFR1, highlighted in some cases by arrows. Results are from a typical experiment repeated three times. Scale bar=10 μm. (b) WT and CerS2 null mice were injected with 25 mg/kg ConA for 8 h and TNFR1 localization determined by confocal microscopy. Arrows indicate internalized TNFR1. Results are from a typical experiment repeated three times. Scale bar=20 μm. (c) Western blot analysis of TNFR1 in membrane (mem) and cytosolic fractions (cyt) from CerS2 null and WT liver. Results are from a typical experiment repeated five times. The Na+/K+ ATPase was used as loading control for membrane fractions, *nonspecific band. GAPDH was used as loading control for cytoplasm fractions. (d) Levels of RIP1 (left-hand) and TRAF2 (right-hand) 6 h after LPS/GLN injection. Upper panels show typical western blots and the lower panels quantification for RIP1 (n=8) and for TRAF2 (n=6) normalized to GAPDH. *P<0.05. (e) cFLIPL levels 6 h after LPS/GLN injection. Upper panels show typical western blots and the lower panels quantification normalized to GAPDH. n=6, *P<0.05. For panels d and e, black bars indicate untreated and open bars treated mice

