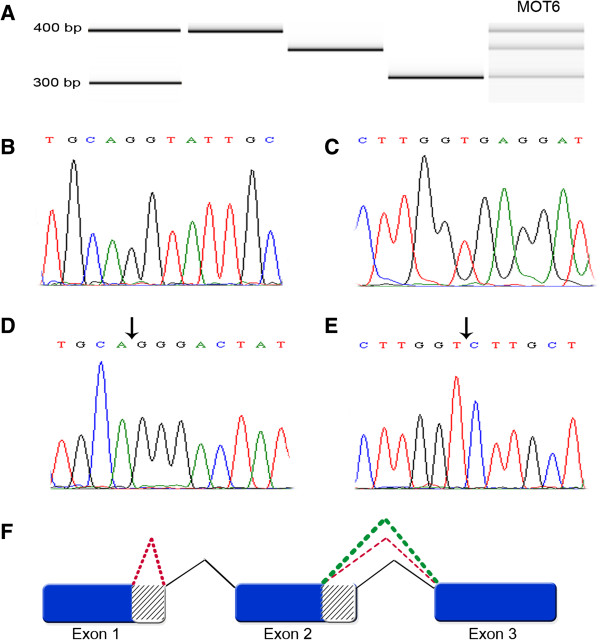
Figure 5.
Cloning and sequencing of novel ZNF695 transcripts associated to ovarian cancer. A) PCR product of ZNF695 showing the three different RNA transcript sizes of ZNF695 expressed in malignant ovary tissue sample 6 (MOT6, right) and the individual amplicons used for cloning, with the size (in base pairs) shown on the left. Ladder (line 1), ZNF695 splice variants 1 and/or 2 (lane 2, 400 bp), ZNF695 splice variant 4 (lane 3, 360 bp), ZNF695 splice variant 5 (lane 4, 310 bp), and ZNF695 amplicons in MOT6 (line 5). B) Sanger sequence plot of ZNF695 splice variant 1 and 2 at the boundary of exons 1 and 2. C) Sanger sequence plot of ZNF695 splice variant 1 and 2 at the boundary of exons 2 and 3. D) Sanger sequence plot of ZNF695 splice 5. This transcript has alternative splicing in exon 1–2, with the arrow illustrating the alternative splicing site at the exon 1–2 boundary. E) Sanger sequence plot of ZNF695 splice variant 4. This sequence has alternative site splicing in exon 2–3 (arrows), this sequence are contain in ZNF695 variant 5 too. F) AS model of ZNF695 gene. Black lines represent primary splicing of exons 1-2-3 of ZNF695 gene containing the full coding sequence that corresponds to the largest amplicon. Green dotted line shows exons 2–3 AS, which corresponds to the intermediate amplicon. Red dotted line shows exon 1 AS together with exons 2–3 AS, which are contained in the smaller amplicon.

