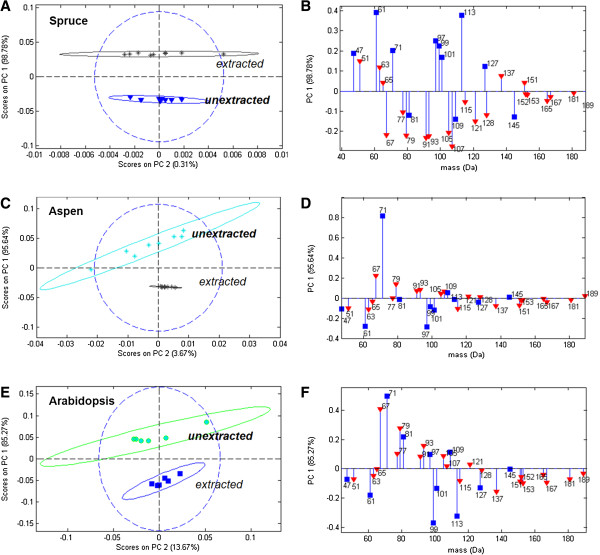
Figure 2.
PCA models showing differences in lignin and polysaccharide-related ToF-SIMS peak intensities due to solvent extraction. PCA scores (A,C,E) and loadings (B,D,F) for positive ion ToF-SIMS spectra for red spruce sapwood (A,B), trembling aspen sapwood (C,D) and Arabidopsis thaliana stem (E,F) using the list of lignin and polysaccharide-characteristic peaks from Ref [1]. Ellipses in scores plots represent 95% confidence intervals. In the loadings, red triangles denote lignin-related peaks and blue squares denote polysaccharide-related peaks.

