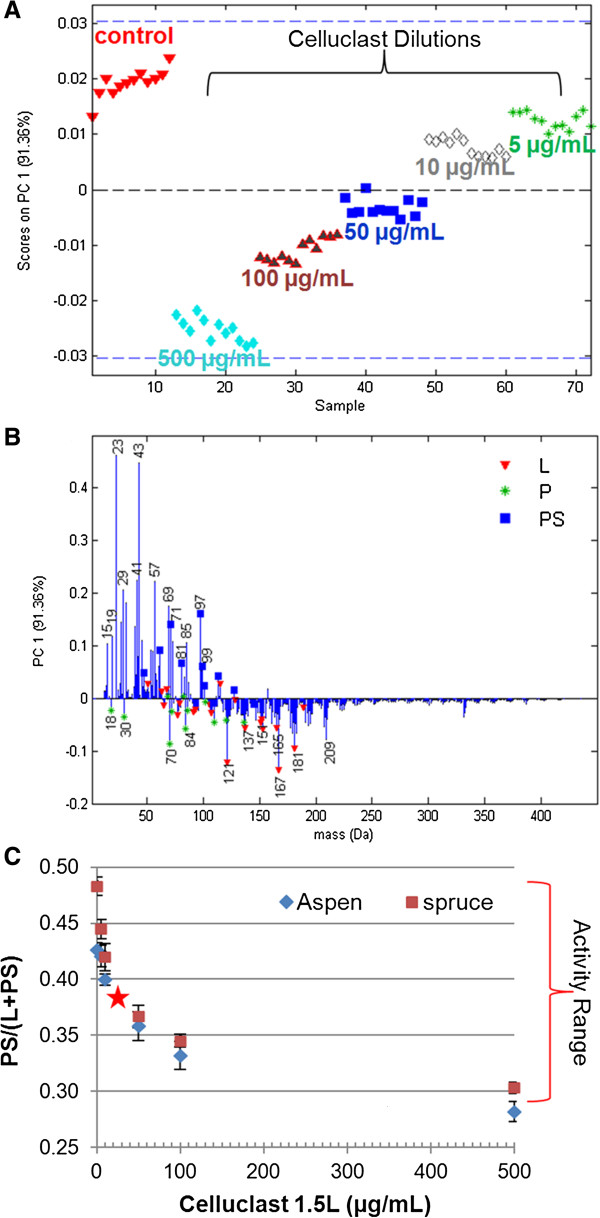
Figure 3.

Establishment of a dose–response curve for extracted trembling aspen treated with Celluclast enzyme dilutions. PCA scores (A) and loadings (B) illustrate which peaks in the full spectra changed intensity with cellulase treatment. Peaks in the loadings descriptive of lignin (L), protein (P) and polysaccharides (PS) are denoted by red triangles, green stars and blue squares, respectively. The dose–response curve (C) compares the polysaccharide peak fraction [1] against the Celluclast concentration for both extracted red spruce and trembling aspen. Error bars represent one standard deviation (n = 9). The red star estimates the point of 50% surface conversion (50% of the activity range in the PS/(L + PS) polysaccharide peak fraction).
