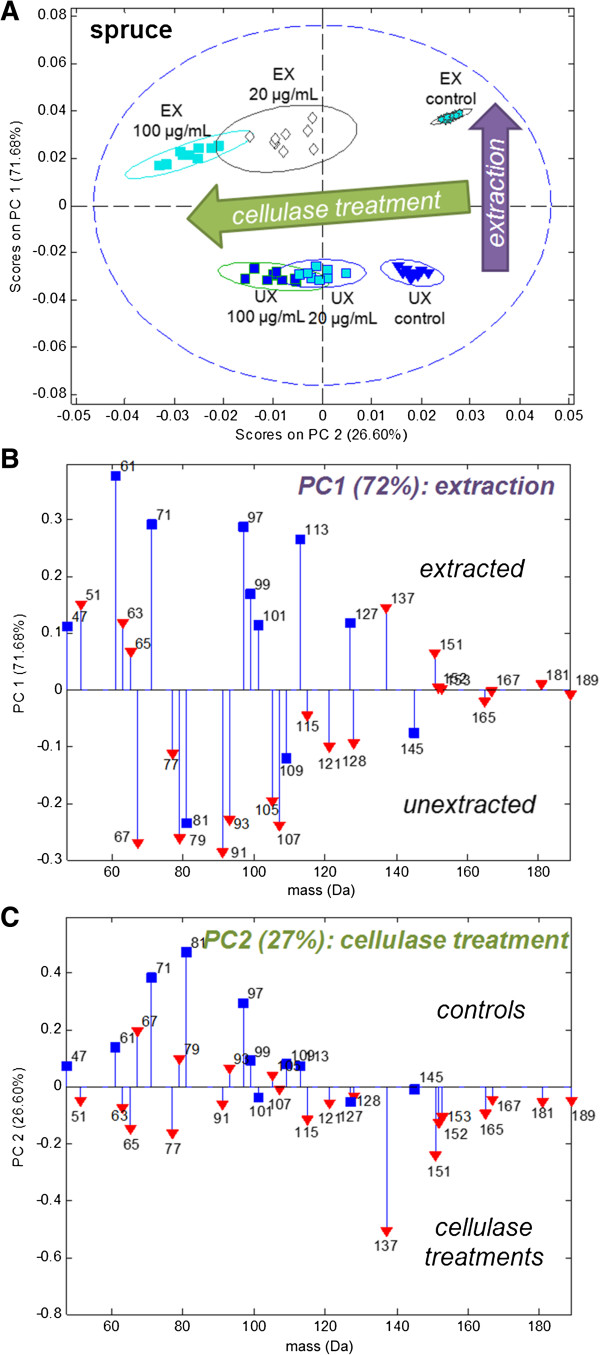
Figure 4.

Distinction of enzyme activity and sample extraction for red spruce in a single PCA model. PCA scores (A) and loadings (B,C) for a single PCA model describing positive ion ToF-SIMS spectra of extracted and unextracted red spruce incubated with pH 4.9 buffer alone (control) or with added 20 μg/mL or 100 μg/mL Celluclast enzyme (pH 4.9, 50°C, 1 h). Ellipses in scores plots represent 95% confidence intervals. Model was built with the list of lignin and polysaccharide-characteristic peaks from Ref [1]. In loadings, red triangles denote lignin-characteristic peaks and blue squares denote polysaccharide-characteristic peaks.
