Figure 6.
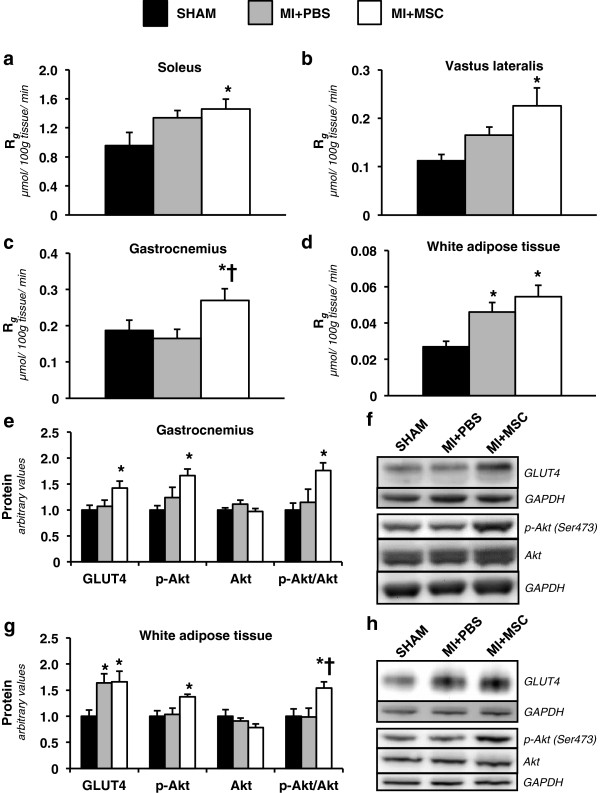
Insulin-stimulated peripheral tissue glucose utilization. (a) Metabolic index of glucose uptake (Rg) in the soleus. (b) Metabolic index of glucose uptake (Rg) in the superficial vastus lateralis. (c) Metabolic index of glucose uptake (Rg) in the gastrocnemius. (d) Metabolic index of glucose uptake (Rg) in white adipose tissue. Tissue Rg values are relative to brain Rg. n = 9 mice per group. (e) Gastrocnemius glucose transporter 4 (GLUT4), phospho-Akt (p-Akt), Akt and p-Akt-to-total Akt ratio (p-Akt/Akt) as determined by immunoblotting. n = 6-8 mice per group. (f) Representative immunoblotting performed to measure gastrocnemius GLUT4, p-Akt and Akt. (g) White adipose tissue glucose transporter 4 (GLUT4), phospho-Akt (p-Akt), Akt and p-Akt-to-total Akt ratio (p-Akt/Akt) as determined by immunoblotting. n = 6 mice per group. (h) Representative immunoblotting performed to measure white adipose tissue GLUT4, p-Akt and Akt. Protein levels are normalized to glyceraldehyde-3-phosphate dehydrogenase (GAPDH) content and are expressed relative to the SHAM group. Data are mean ± S.E.M. *p < 0.05 vs. SHAM. †p < 0.05 vs. MI + PBS.

