
Figure 1.
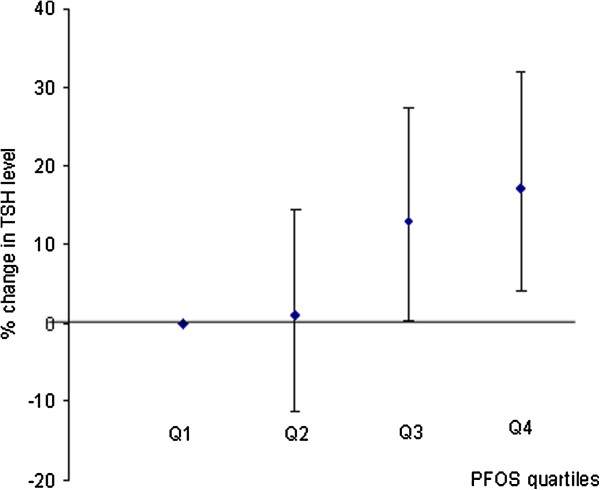
Changes (%) in TSH level with increases in PFOS quartiles. In the linear regression model, PFOS (ng/mL) was divided into quartiles (Q1: ≤ 10.30; Q2: >10.30 and ≤13.09; Q3: >13.09 and ≤16.58; Q4: >16.58). Q1 was used as reference group and each quartile was compared with the reference group. The model was adjusted for maternal age, gestational age at blood draw, HDL concentrations, total seafood intake, parity and inter-pregnancy interval.