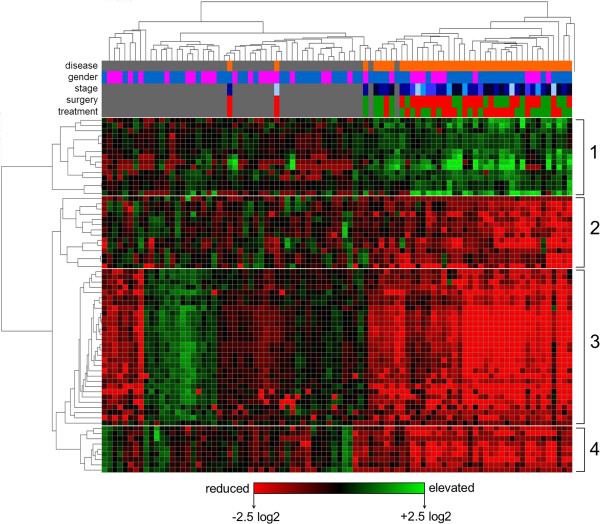
Figure 2.
Hierarchically-clustered metabolite array. The same dataset used for PCA in Figure 1 was log2 normalized to the control mean and hierarchically clustered by mass (using a Pearson correlation) and by subject (using a Manhattan correlation). Colored rows at the top of the array indicate variable assignments for subjects (disease status, grey = control subject, orange = PC patient; gender, blue = male, pink = female; stage, light blue = stage I, dark blue = stage IV; surgery, red = yes, green = no; chemo/radiation treatment, red = yes, green = no). The heatmap is colored according to log2 intensity ratio; red = lower relative to control mean, green = higher relative to control mean. Metabolite clusters are numbered one through four on the right.

