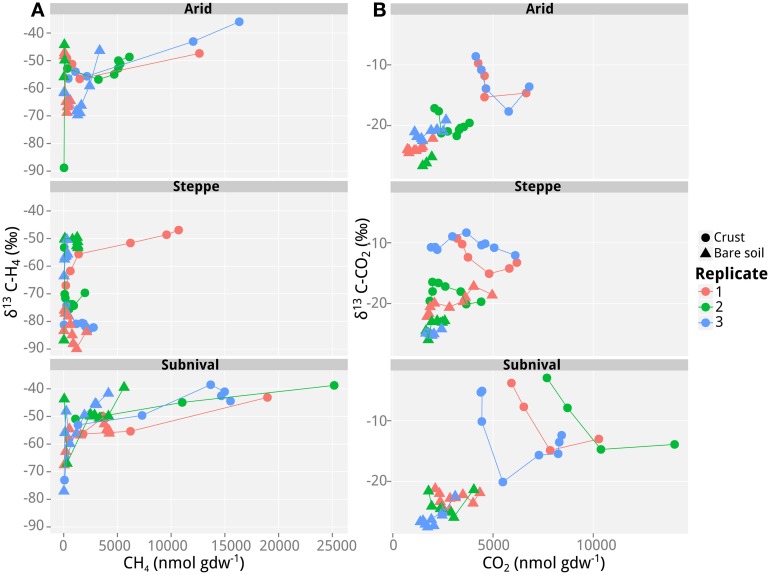
Figure 1.
Values of δ13C of CH4 and CO2 as a function of CH4 and CO2 concentrations in incubations with soil samples from the different vegetation belts in Tsomoriri Plains. Depicted are the three vegetation belts samples: arid, steppe, and subnival. (A) δ13C of CH4 and (B) δ13C of CO2. Only samples producing >40 nmol g−1 CH4 produced reliable δ13C measurements of CH4 and are shown here. Temporal progression is always along the x-axis. Three biological replicates were analyzed and each data point represents a mean of n = 3 technical replicates.

