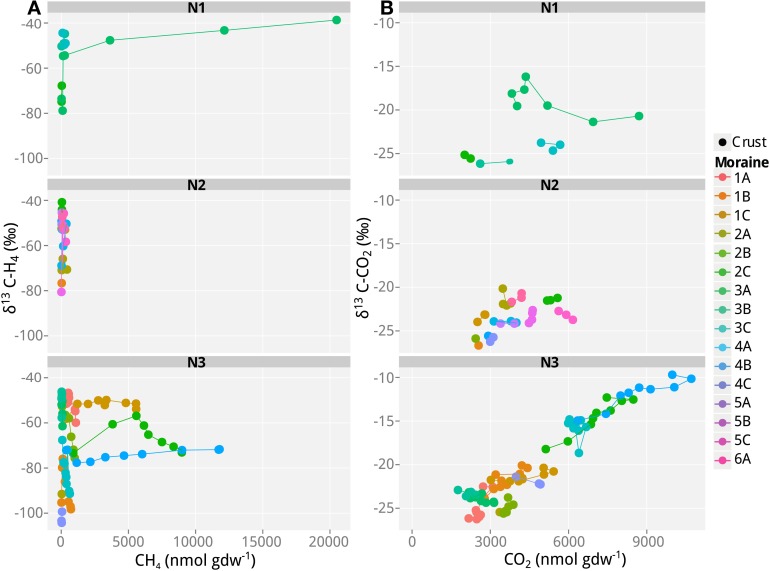
Figure 3.
Values of δ13C of CH4 and CO2 as a function of CH4 and CO2 concentrations in incubations with soil samples from the different frontal moraines in Nubra Valley. (A) δ13C of CH4 and (B) δ13C of CO2. Only samples producing >40 nmol g−1 CH4 produced reliable δ13C measurements of CH4 and are shown here. N1, glacier 1 in Nubra Valley, containing 4 moraines; N2, glacier 2 with 6 moraines, N3, glacier 3 with 4 moraines. Temporal progression is always along the x-axis. Means of n = 3 (technical replicates).

