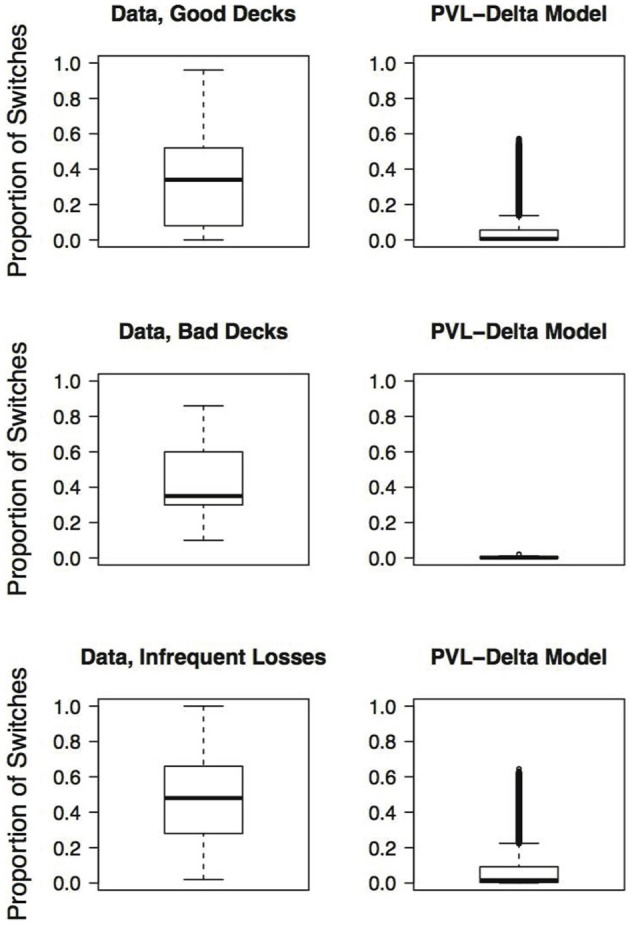
Figure 1.

Boxplots of observed and generated proportions of switches during the last 50 trials, given a pronounced deck preference. Each row presents the results for different pronounced choice patterns: First row: Pronounced preference for the good decks; Second row: Pronounced preference for the bad decks; Third row: Pronounced preference for the decks with infrequent losses. The first column presents the switches of 211 healthy participants selected from the Steingroever et al. (2013a) data pool (cf. 2). The second column presents the switches generated by the PVL-Delta model (cf. 4).
