Figure 5.

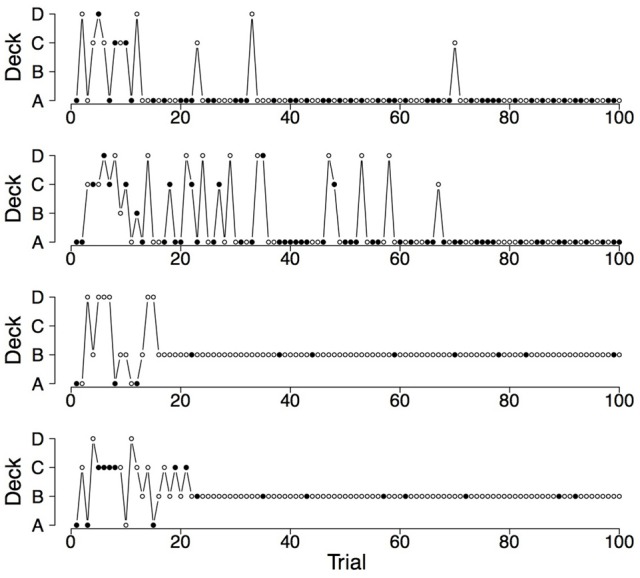
Deck selection profiles of four synthetic participants showing a pronounced preference for the bad decks (generated by the PVL-Delta model; A = 1.00, w = 0.08, a = 0.05, c = 2.71).

Deck selection profiles of four synthetic participants showing a pronounced preference for the bad decks (generated by the PVL-Delta model; A = 1.00, w = 0.08, a = 0.05, c = 2.71).