
Figure 5.
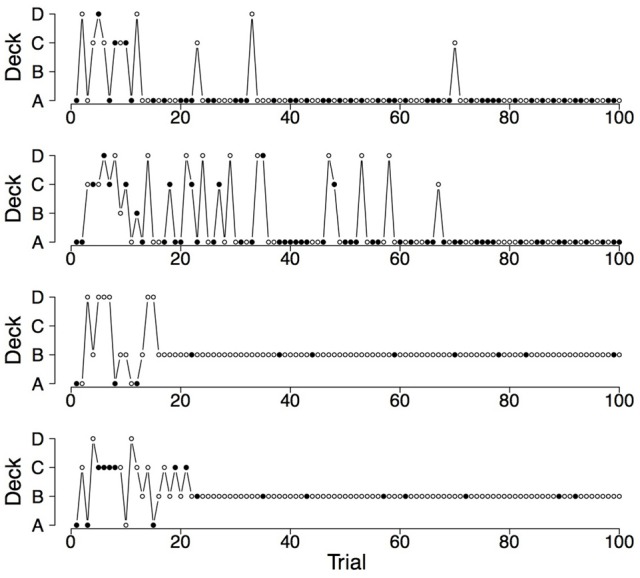
Deck selection profiles of four synthetic participants showing a pronounced preference for the bad decks (generated by the PVL-Delta model; A = 1.00, w = 0.08, a = 0.05, c = 2.71).
Official websites use .gov
A
.gov website belongs to an official
government organization in the United States.
Secure .gov websites use HTTPS
A lock (
) or https:// means you've safely
connected to the .gov website. Share sensitive
information only on official, secure websites.
Deck selection profiles of four synthetic participants showing a pronounced preference for the bad decks (generated by the PVL-Delta model; A = 1.00, w = 0.08, a = 0.05, c = 2.71).