
Figure A3.
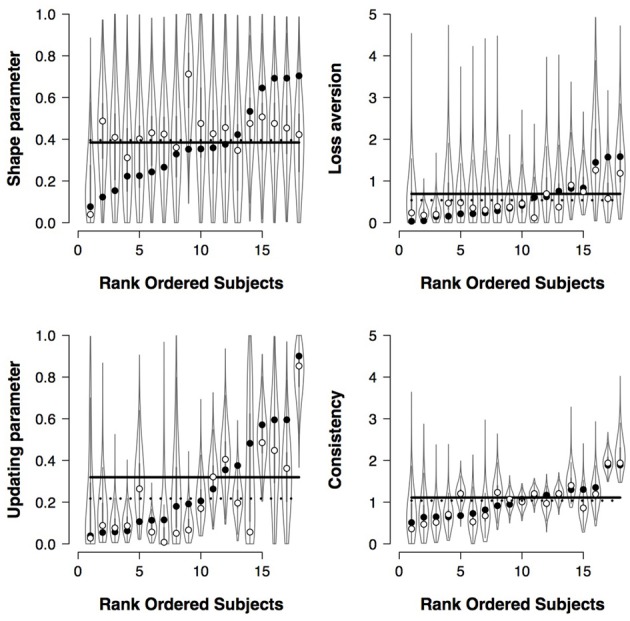
Recovery of individual and group-level parameters of the PVL-Delta model. Data of 18 participants completing a 100-trial IGT. The dotted lines represent the modes of the group-level posteriors and the unfilled dots the modes of the group-level posterior.