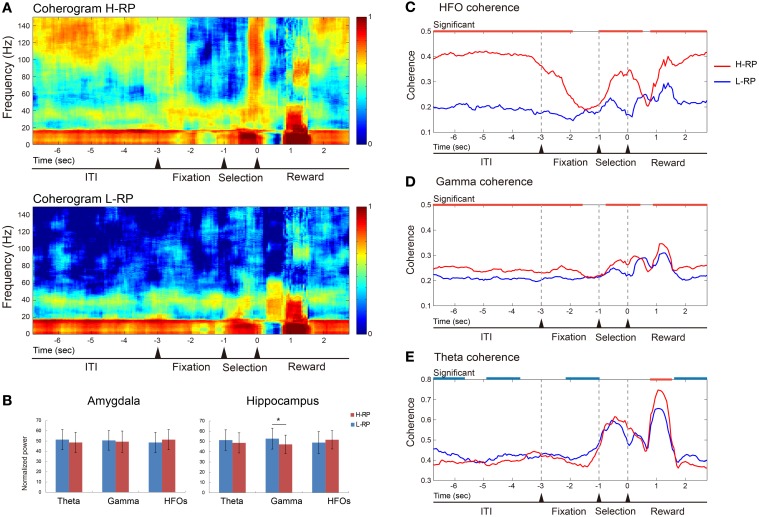
Figure 6.
Example of data of LFP coherence and power between the amygdala and the hippocampus. (A) Coherence presented as coherograms under the H-RP (upper) and L-RP (lower) conditions. The ordinates indicate the frequency of coherence. The abscissas indicate the time course and the time of zero is the time when the rat poked its nose into the selected hole. Colors in the graph indicate the strength of coherence. (B) Averaged powers presented as normalized PSDs between H-RP and L-RP conditions in the amygdala (left) and hippocampus (right). Each of the three different bands of oscillation (theta, gamma, and HFOs) was compared. The asterisk indicates a significant difference between H-RP and L-RP. (C) HFO coherences between the amygdala and the hippocampus under H-RP and L-RP conditions. The ordinate indicates the strength of coherence. The abscissa indicates the time course and the time of zero means the time when the rat poked its nose into the selected hole. Periods of significantly (p < 0.05) stronger coherence under the H-RP condition are indicated by the red horizontal lines at the top of the graph. (D) Gamma coherences between the amygdala and the hippocampus under H-RP and L-RP conditions. Same format as (C). (E) Theta coherences between the amygdala and the hippocampus under H-RP and L-RP conditions. Same format as (C). Periods of significantly (p < 0.05) stronger coherence under the L-RP condition are indicated by the blue horizontal lines at the top of the graph.

