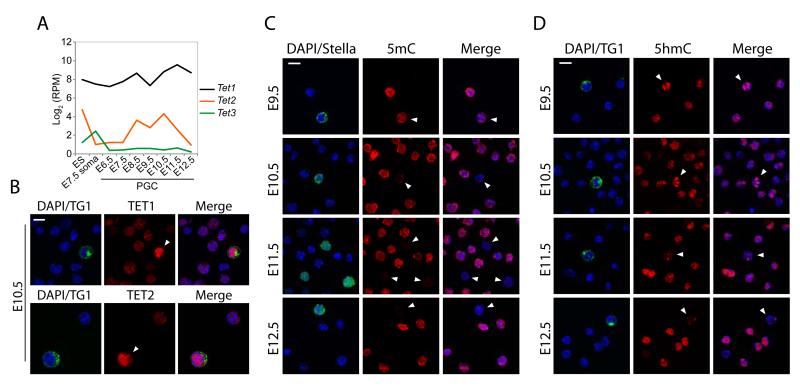
Figure 1. Global dynamics of 5mC, 5hmC & TETs in PGCs.
(A) Single cell RNA-seq analysis of Tet1, Tet2 and Tet3 expression. Shown is Log2 reads per million (RPM). (B) Expression of TET1 and TET2 in E10.5 PGCs (arrowheads) and soma. (C) Dynamics of DNA methylation (5mC) in PGCs shows 5mC erasure between E9.5-E11.5. (D) 5-hydroxymethylcytosine (5hmC) kinetics in PGCs. TG1/STELLA mark PGCs. Scale bar = 10μm.

