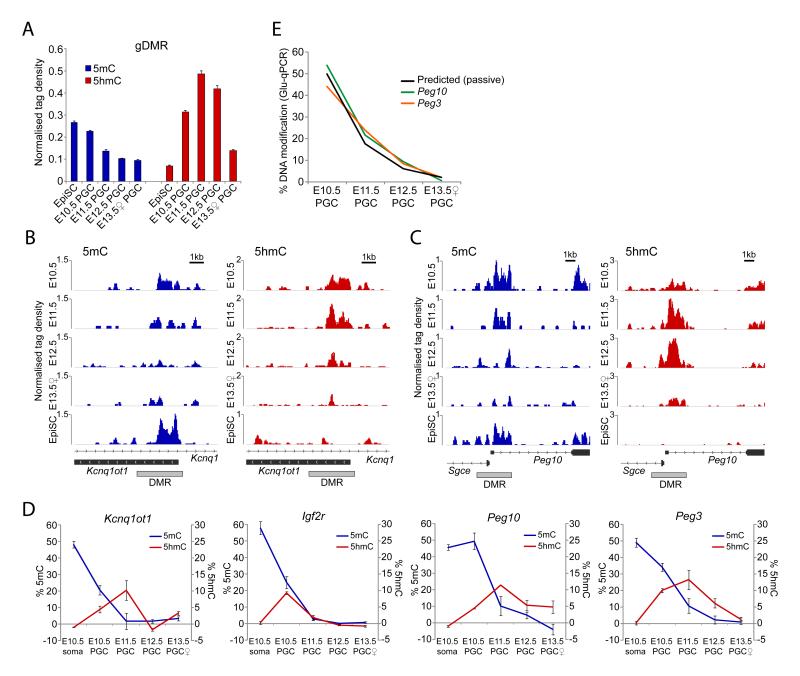
Figure 3. Imprint erasure in PGCs.
(A) Average (h)meDIP-seq enrichment of 5mC and 5hmC across all imprinted gDMRs in PGCs. EpiSC represent monoallelic methylation. (B & C) 5mC and 5hmC profiles of DMRs that undergo (B) early or (C) late 5mC erasure and corresponding delay in 5hmC enrichment. (D) Glu-qPCR analysis of 5mC and 5hmC levels at early (Kcnq1ot1 and Igf2r) and late (Peg10 and Peg3) reprogrammed DMRs. Error bars represent S.E.M. (E) Rate of demethylation to unmodified cytosine. Shown is the predicted rate of passive demethylation and observed rates for Peg10 and Peg3.

