Fig. 4.
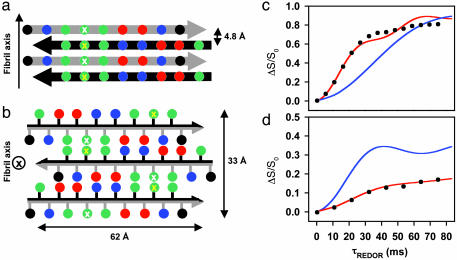
Proposed ccβ fibril model. View of four β-strands perpendicular to the plane of the β-sheets (a) and of the fibril cross section (b). Adjacent strands are related by a twofold screw axis along (a) and perpendicular to (b) the long fibril axis. Amino acid side chains are represented as spheres; the color code is the same as in Fig. 1. The black and gray arrows discriminate between the two faces of the β-strand. Residues at positions 7 and 14 are marked by white and yellow crosses, respectively. (c) REDOR difference signal ΔS/S0 from a sample of ccβ fibrils with 15N label at the amide nitrogen of Ala-7 and 13C label at the carbonyl carbon of Leu-14 as a function of dephasing time τREDOR. Experimental REDOR difference data (•) were obtained from the peak intensities of the carbonyl resonance. The SD for each data point was ± 0.01. The red curve was calculated by assuming an idealized antiparallel structure with extended β-strands and the register being defined by a hydrogen bond between the amide of Ala-7 and the carbonyl of Leu-14. The agreement of the simulation to the data is excellent for the important short dephasing times <20 ms where the transfer is determined primarily by the shorter distance dNC. The blue curve was calculated for a structure in which the register of the strands has been shifted by one residue. (d) REDOR measurements (•) on a 12% double-labeled fibrillized ccβ-p sample. The red and blue curves were calculated for extended interchain hydrogen-bonded β-strands and for a putative hairpin model with intrachain hydrogen bonds between the labeled residues, respectively.

