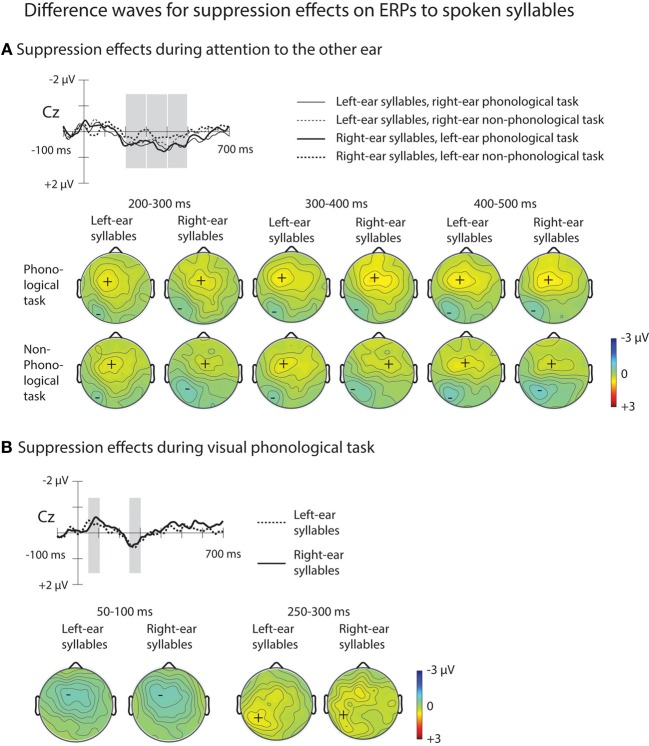
Figure 5.
ERP difference waves illustrating suppression effects on ERPs to spoken syllables (please note that for illustrative purposes, the amplitude scales differ from those used for ERPs in Figures 3, 4). (A) Difference waves for suppression effects on ERPs to left-ear syllables during the right-ear phonological task at Cz electrode were obtained by subtracting grand-average ERPs to left-ear standard syllables during the visual non-phonological task from grand-average ERPs to the left-ear standard syllables during the right-ear phonological task (thin solid line; for the grand-average ERPs, see Figure 3B). Difference waves for suppression effects on ERPs to the right-ear syllables during the left-ear phonological tasks were obtained by subtracting grand-average ERPs to the right-ear syllables during the visual non-phonological task from grand-average ERPs to the right-ear syllables during the left-ear phonological task (thick solid line). Difference waveforms for non-phonological tasks were obtained accordingly (thin dotted line for left-ear syllables and thick dotted line for right-ear syllables during non-phonological tasks to the other ear, respectively). Maps below these difference waves show scalp distributions of suppression effects (the rejection positivity; RP) measured in each participant at each electrode over the time windows (marked in Cz difference waves) 200–300, 300–400, 400–500 ms from syllable onset. (B) Difference waves at Cz electrode illustrating suppression effects on ERPs to spoken syllables during the visual phonological task. Difference waves for the left-ear and right-ear standard syllables (dotted and solid line, respectively) were obtained by subtracting grand-average ERPs to the left-ear and right-ear syllables during the visual non-phonological task from grand-average ERPs to the left-ear and right-ear standard syllables, respectively, during the visual phonological task (for the grand-average ERPs, see Figure 3A, bottom row). The analysis windows at 250–300 ms for the rejection positivity (RP) and at 50–100 ms for the preceding negative ERP displacement are marked with gray rectangles in the difference waves at the Cz electrode and maps for the scalp distribution of the mean amplitudes at these time windows are shown below separately for the left-ear and right-ear syllables.

