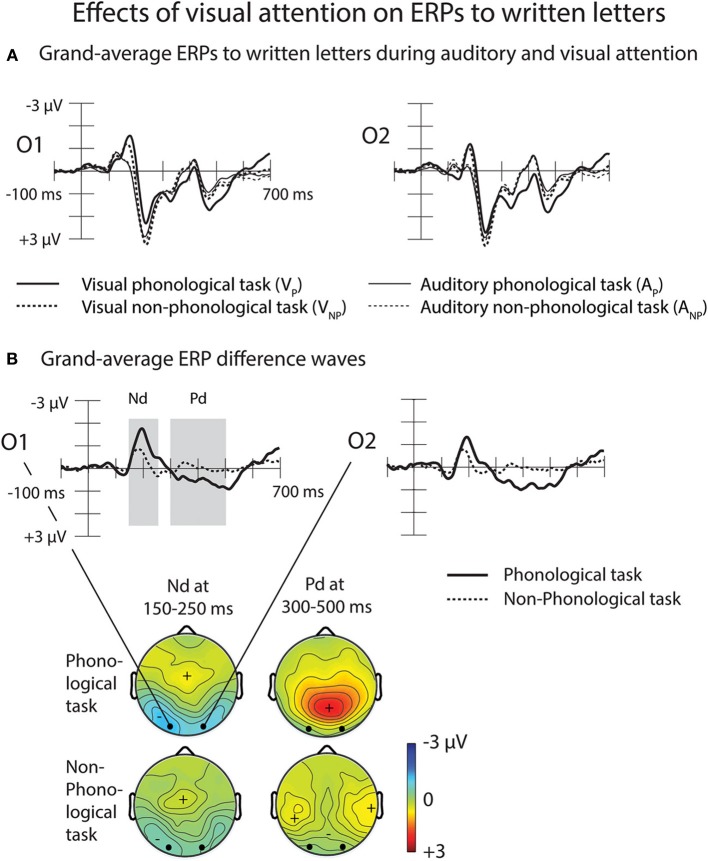
Figure 6.
Effects of visual attention on ERPs to written letters. (A) Grand-average ERPs to written letters during auditory and visual attention at the O1 and O2 electrodes. (B) Effects of visual attention on ERPs to written letters at the O1 and the O2 electrodes illustrated by difference waves obtained by subtracting grand-average visual ERPs during auditory phonological tasks (solid lines, data combined across the left-ear and right-ear phonological tasks) and during auditory non-phonological tasks (dotted lines, data combined across the left-ear and right-ear non-phonological tasks) from grand-average visual ERPs during the visual phonological and visual non-phonological tasks, respectively. Scalp distribution maps on the right panel show the visual Nd effect (150–250 ms from letter appearance) and the subsequent Pd effect (300–500 ms from letter appearance) determined after measuring in each participant the mean Nd and Pd amplitudes at each electrode over these time windows marked in the O1 and O2 difference waves. Please note that the negative Nd maxima are shown in cyan/blue and positive Pd maxima in yellow/red.

