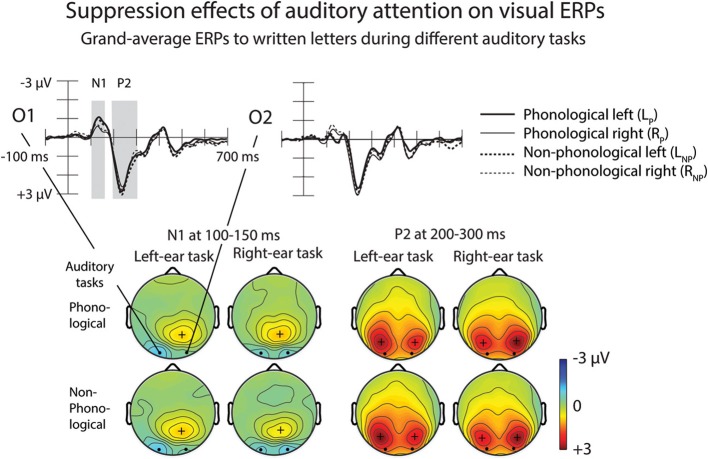
Figure 7.
Suppression effects of auditory attention on visual ERPs. Grand-average ERPs to written letters during different auditory tasks at the O1 and O2 electrodes are shown on the upper panel. Scalp maps on the lower panel show N1 and P2 responses at 100–150 and 200–300 ms from letter appearance, respectively. Time windows are marked in the O1 and O2 difference waves. Please note that the negative N1 maxima are shown on cyan/blue and positive P2 maxima in red.

