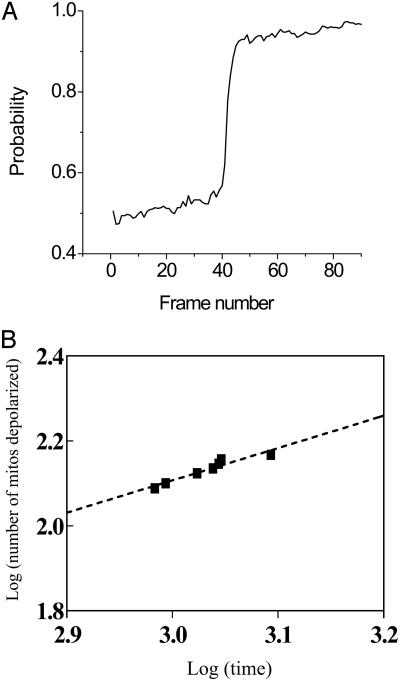
Fig. 5.
Quantitative analysis of the mitochondrial network. (A) The probability of a mitochondrion belonging to the spanning cluster increases dramatically at percolation threshold, pc (see also Fig. 2D). This was calculated from frequency histograms of “grid objects” (mitochondria) with CM-DCF fluorescence intensity above baseline. The baseline was obtained averaging the maximal fluorescence value from the frequency distribution of the initial 10–20 images before the flash. The probability was calculated as total number of mitochondria with values above baseline over the total number of objects in the grid. (B) The quantitative relationship between the critical exponents at the first global ΔΨm depolarization can be calculated from double-log plots of the number of depolarized mitochondria versus time near pc (within approximately ±3–5% of pc) for the first global depolarization (15). The straight line conforms to a power law and the total number of depolarized mitochondria scales as t(ν – β)/δ, with t being time. Thus, the slope gives ν – β/δ (= 0.760; r2 = 0.920, for the example presented).

