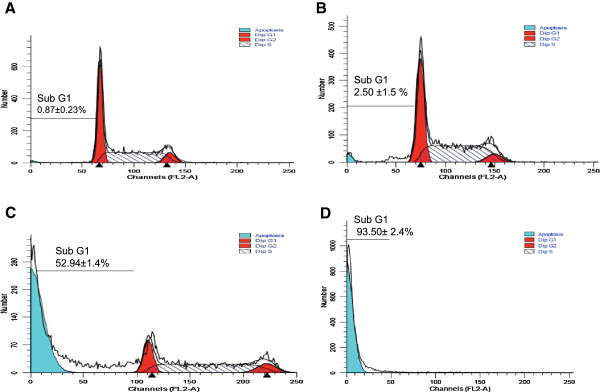
Figure 5.

Cell cycle analysis of DP extract on HL-60 cells after 24 h. (A): Control; (B): 20 μg/ml; (C): 50 μg/ml; (D): 100 μg/ml. Data shown are expressed mean ± SD, Values affected with different letter are significantly different in the group, (p < 0.05).
