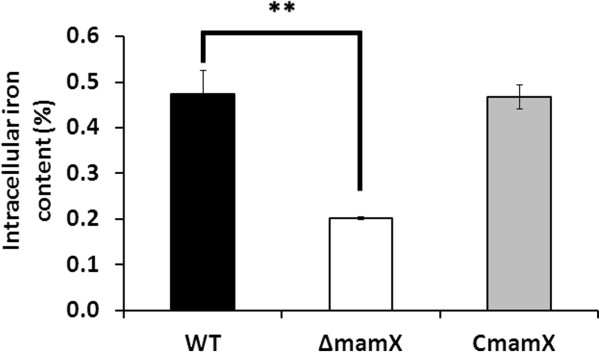
Figure 2.

Intracellular iron contents during culture of WT, ∆mamX, and CmamX. The intracellular iron content was much lower for ∆mamX (0.20%) than for WT and CmamX (both 0.47%). **, The difference between WT and ∆mamX was statistically significant (P < 0.01, by t test).
