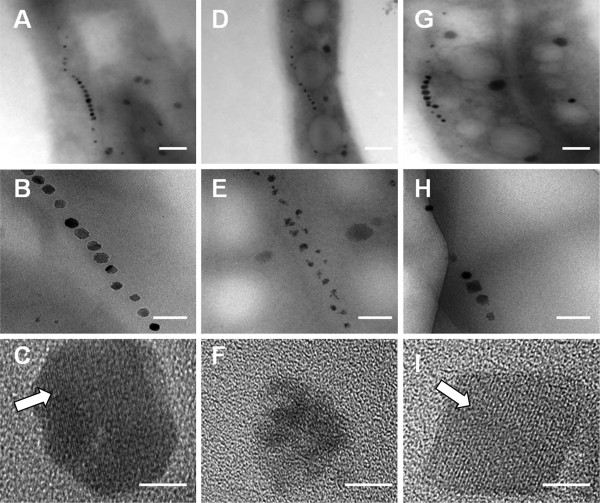
Figure 3.
HR-TEM observation of different cells. HR-TEM of WT (A, B, C), ∆mamX(D, E, F), and CmamX(G, H, I). A, D, G: cell phenotype and magnetosome location. B, E, H: magnetosome chain organization. C, F, I: crystal lattice structure. Arrows: standard Fe3O4 crystal lattice. Scale bars: A, D, G: 200 nm; B, E, H: 100 nm; C, F, I: 10 nm.

