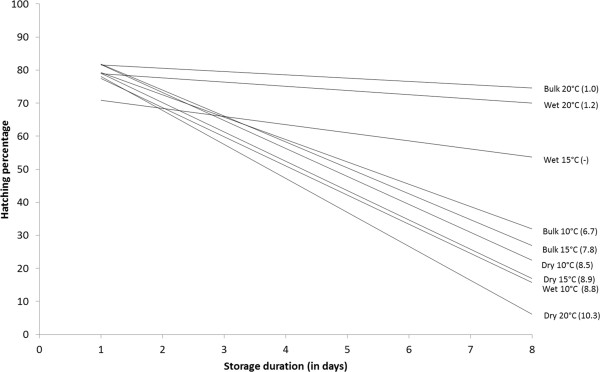
Figure 3.

Relationship between percent hatch and storage duration for each treatment temperature/storage condition. Slope of each regression line is indicated in parentheses (no slope was given for Wet 15°C since the Pearson correlation coefficient was not significant).
