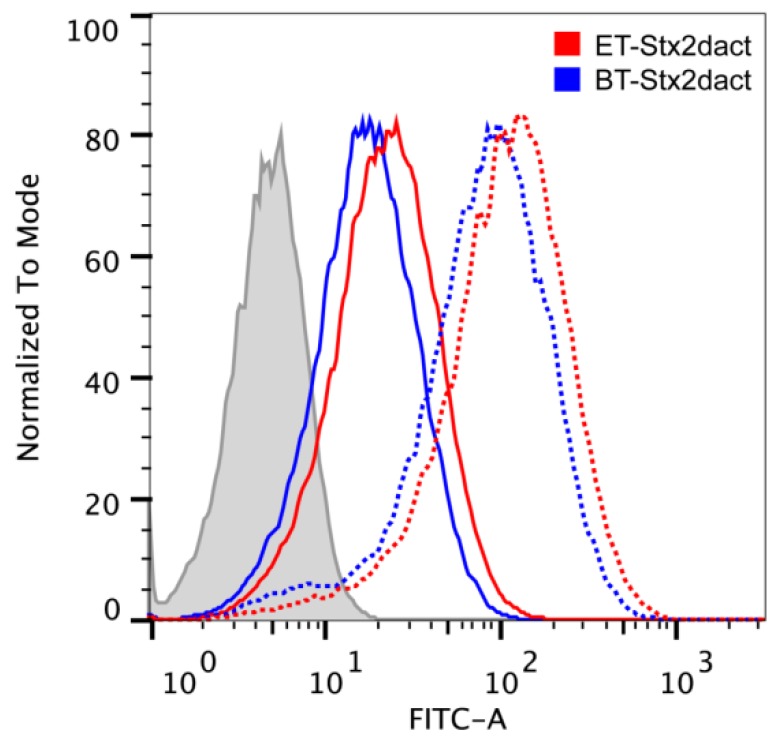
Figure 3.
Flow cytometric profiles of ET- and BT-Stx2dact binding to Vero cells. Vero cells were treated with either no toxin (grey), 250 ng (dotted lines), or 31.3 ng (solid lines) of ET- or BT-Stx2dact. With 250 ng of toxin, we observed a right shift in both populations with a MFI of 113 and 86.5 for ET- and BT-Stx2dact, respectively. With 31.3 ng of toxin, we observed a right shift in both populations with a MFI of 22.4 and 17.4 for ET- and BT-Stx2dact, respectively.

