Figure 1.
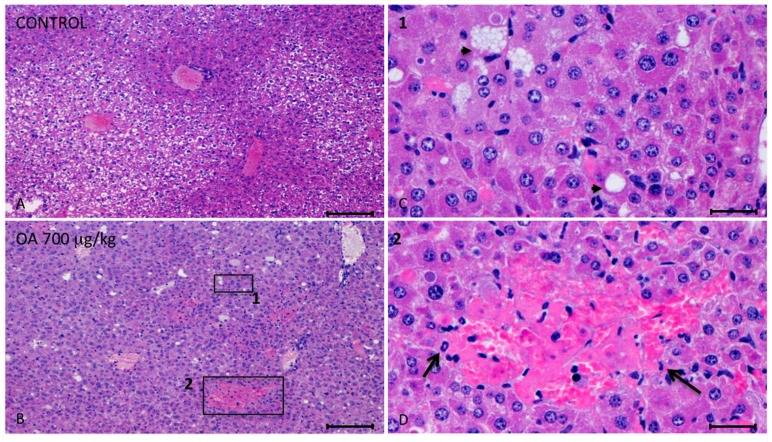
Photomicrographs of liver sections from both control and treated animals. (A–D) Photomicrographs of liver sections from control (A) and 700 μg/kg OA-intoxicated mice (B–D) showing necrotic areas in liver of treated animals (B). (C) Amplified area of photomicrograph B (1). Neighboring hepatocytes to the necrotic lesions showed cellular swelling, lipid vacuoles of different sizes (arrow heads) and either pleomorphic or pyknotic nuclei. (D) Amplified area of photomicrograph B (2). Multifocal aggregates of necrotic hepatocytes randomly located with the consequent dilation of the sinusoids, and polymorphonuclear inflammatory infiltrates (arrows) could be observed. Scale bars, 200 μm (A and B) and 20 μm (C and D).

