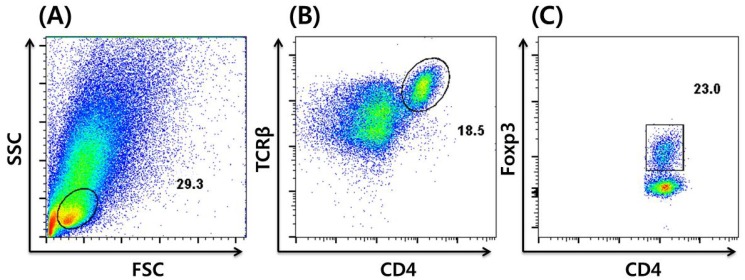
Figure 2.
Flow cytometric analysis of Tregs by intracellular staining of Foxp3. (A) Lymphocytes are gated by forward scatter (FSC) vs. side scatter (SSC), followed by (B) CD4+ T-cell gating on CD4 and TCRβ. (C) Foxp3+ Tregs gated out of CD4+ TCRβ+ T-cells. The numbers indicate the percentage of the gated cells out of the total number of cells within the plot.

