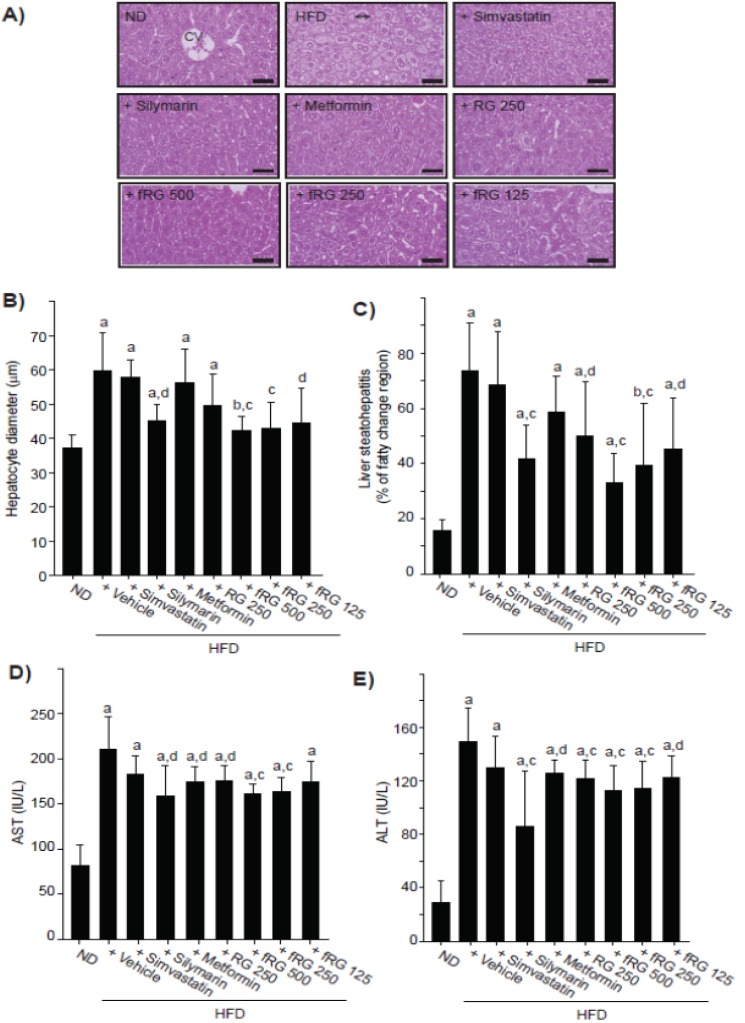
Figure 4.
Effect of fRG on HFD-induced liver damages. The representative histological images of liver tissues (A) were stained with H & E (Scale bars = 80 μm). The mean diameter at least 10 hepatocytes was measured using automated image analysis process (B). Percentage of fatty changed regions (liver steatohepatitis) was calculated in 1 mm2 of hepatic parenchyma (C). The levels of AST (D) and ALT (E) were also measured as described in Figure 3. All values were expressed mean ± S.D. of eight mice (Significant as compared with ND-fed mice, a p < 0.01; b p < 0.05; significant as compared with HFD-fed mice, c p < 0.01; d p < 0.05).

