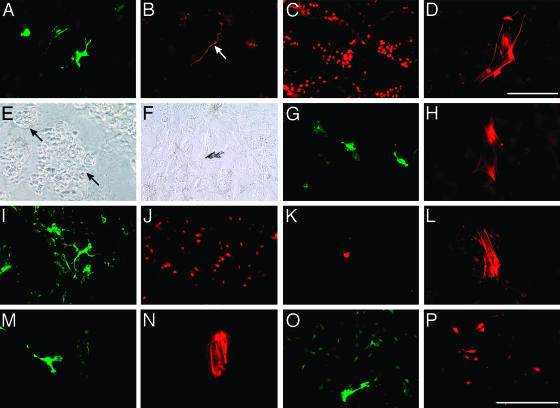
Fig. 1.
Phenotypic analysis of NCC in primary clones on 3T3 cells (A–L) and in subclones on collagen (M–P). (A–H) Cephalic NCC in control medium. (A–D) GNMF clone with cells expressing SMP (A), neurofilament (B, arrow), MelEM (C), and α-SMA (D) antigens. (E–H) GMFC clone showing cartilage islets (arrows in E, phase–contrast), a pigment cell (F, bright field), and cells positive for SMP (G) and α-SMA (H). (I–L) Trunk NCC in presence of ET3. GNMF clone with cells expressing SMP (I), MelEM (J), tyrosine hydroxylase (K), and α-SMA (L) is shown. (M and N) Cephalic NCC secondary cloning in the presence of ET3. GF subclone with cells immunoreactive for SMP (M) and α-SMA (N) is shown. (O and P) Trunk NCC tertiary cloning in the presence of ET3. GM subclone with cells positive for SMP (O) and MelEM (P) is shown. (Scale bar in P represents 50 μm; scale bar in D is 15 μm for D only.)

